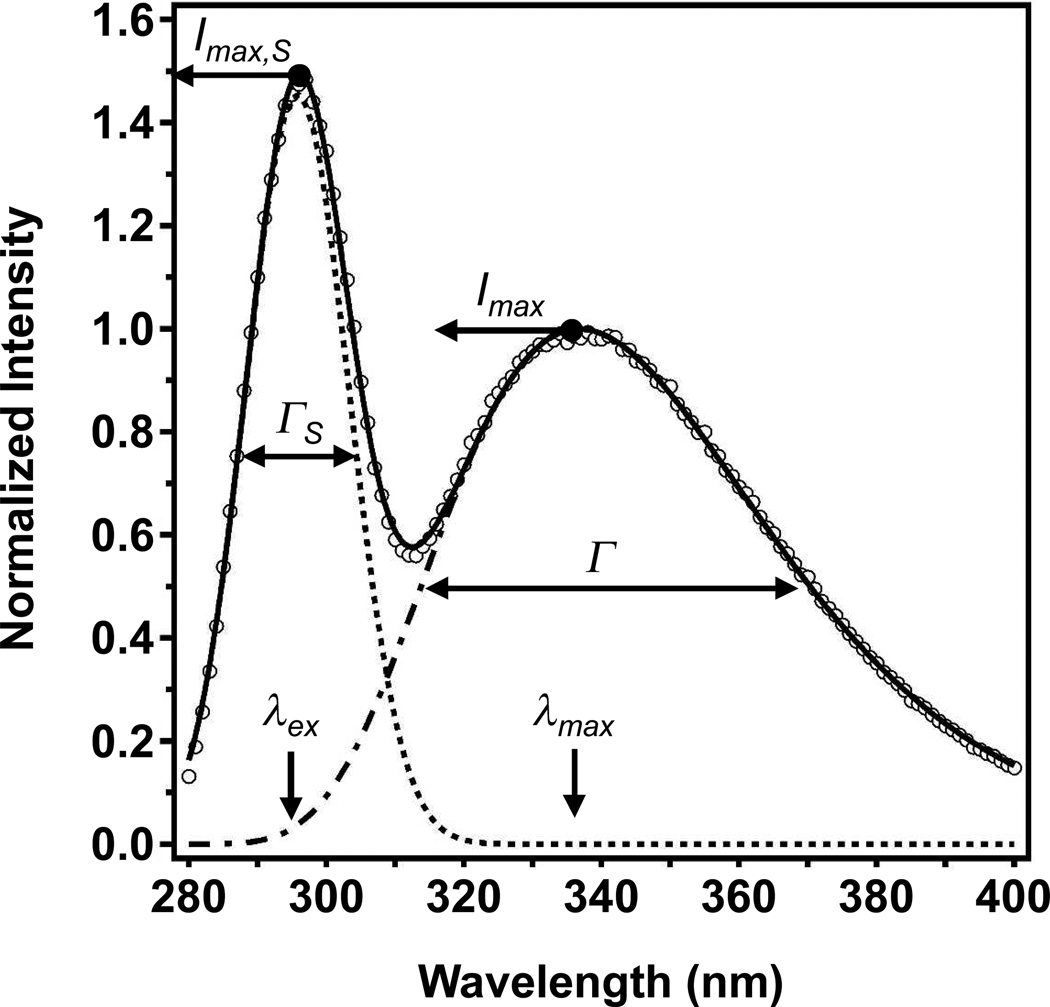
Fig. 1.
Relative contributions of light scattering and tryptophan fluorescence emission to the observed data from a typical fluorescence experiment. The observed data (open circles) came from a sample of 400 nM FadL folded into LUVs of DLPC at a lipid-to-protein ratio of 2000-1 and in 1.5 M guanidine HCl, 2mM EDTA, and 100mM citrate, pH 3.8. The sample was excited at 295 nm, the excitation polarizer was set at 90°, and the emission polarizer was set at 0°. The sample pathlength was 10 mm, the excitation slits were 2.4 mm wide, and the emission slits were 2.0 mm wide. The solid line represents a fit to the observed data by a sum of a normal distribution and a log normal distribution as described by Eq. (3). Fit parameters from Eq. (3) are labeled next to the parts of the data that they describe. The dotted line is the normal distribution component of Eq. (2), which represents light scattering at the excitation wavelength. The dot/dashed line represents the log normal distribution component of Eq. (1), which describes the fluorescence emission of the tryptophans in FadL.

