Fig. 4.
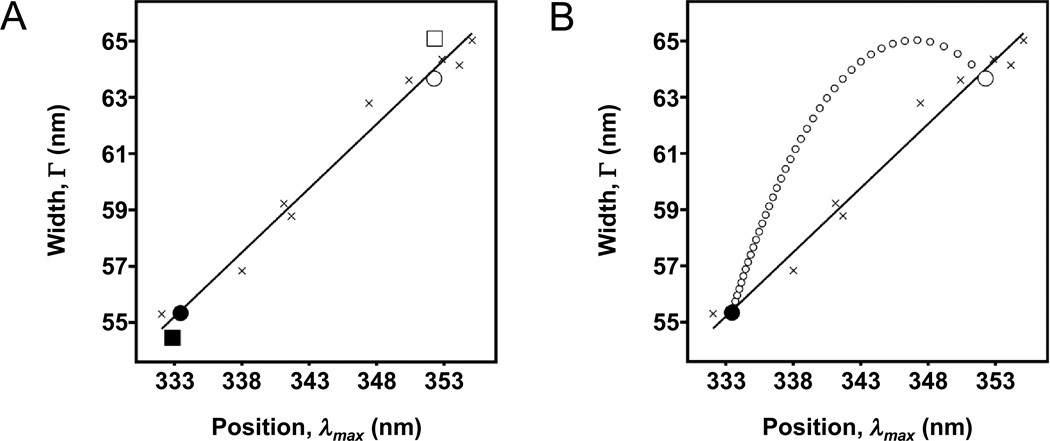
Position-width analysis of tryptophan fluorescence from folded and unfolded outer membrane proteins. Positions (λmax) and widths (Γ) come from fits to Eq. (3). The solid line is a linear fit to data from spectra of N-acetyl-tryptophan-amide dissolved in different solvents or mixtures of solvents (crosses). (A) Two proteins, FadL (filled square) and OmpW (filled circle), were folded into LUVs of DLPC in 1.5 M guanidine HCl. The two proteins were also unfolded in the presence of the same LUVs but in 5.5 M guanidine HCl (open symbols of the same shapes). (B) Simulated data (small open circles) showing the expected heterogeneity of tryptophan environments when different fractions of an ensemble of OmpW molecules are folded versus unfolded. These different fractions could be obtained, for example, when a sample of OmpW is titrated into different concentrations of guanidine HCl. Each data point along the arc comes from Eq. (12) and represents a 2.5% step in a mixture of the folded and unfolded states. The endpoints of the arc (large circles) were taken from the actual data for OmpW shown in (A).

