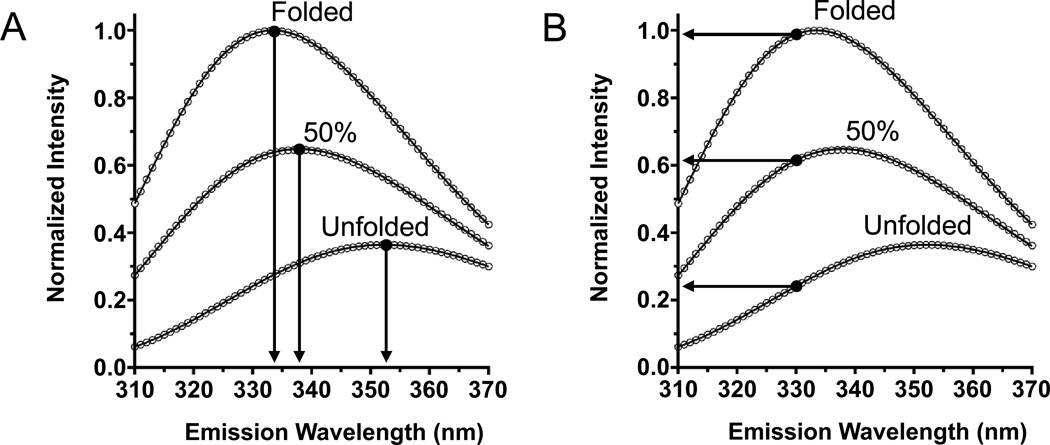
Fig. 5.
Comparison of the dependence of two spectral parameters to the fraction of folded OmpW in a sample. Tryptophan fluorescence emission intensity is normalized to the peak intensity (Imax) of a folded sample of OmpW in LUVs of DLPC in 1.5 M guanidine HCl. The unfolded sample of OmpW is in the same LUVs but instead is in 5.5 M guanidine HCl. The curve for 50% folded protein was generated using Eq. (12) and the spectra from folded and unfolded protein samples. (A) Emission intensity at a fixed wavelength (e.g., 330 nm) linearly depends on the fraction of folded protein. (B) The position of maximum emission (λmax) does not linearly depend on the fraction of folded protein.

