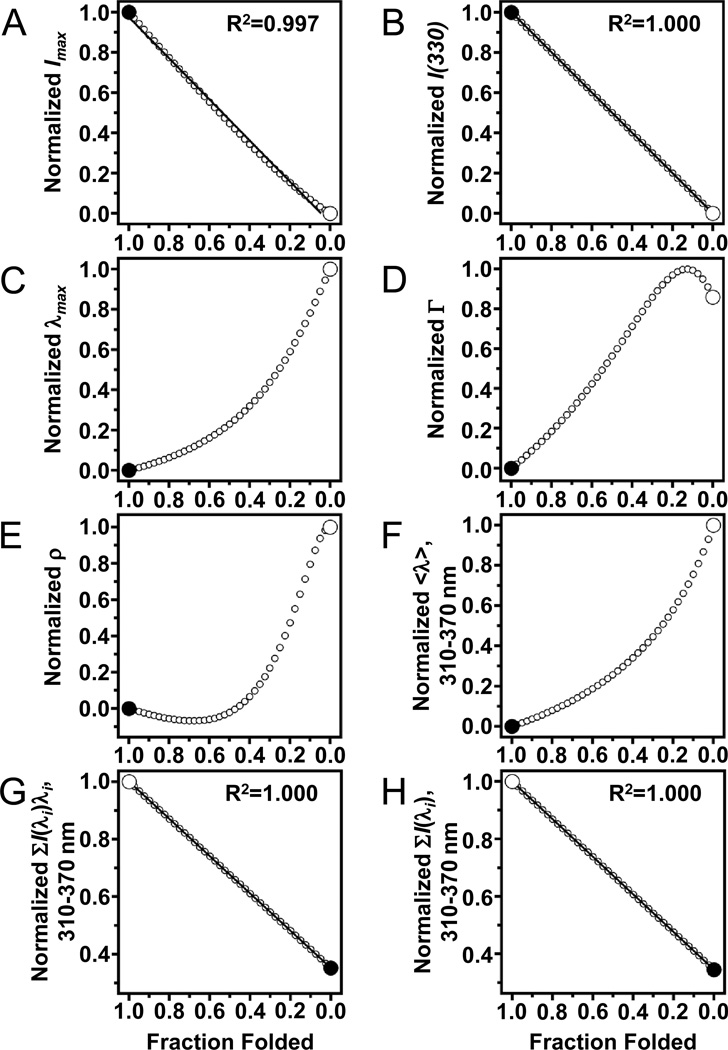
Fig. 6.
Not every spectral parameter of tryptophan fluorescence linearly depends on fraction folded. The endpoints of each plot (large circles) were taken from actual data for folded and unfolded samples of OmpW with LUVs of DLPC in 1.5 M and 5.5 M guanidine HCl, respectively. Other data points (small circles) come from Eq. (12) and represent 2.5% steps of simulated mixtures of the folded and unfolded samples. (A) Peak intensity (Imax). Solid line represents a linear fit to the data points. (B) Emission intensity at 330 nm. Solid line represents a linear fit to the data points. (C) Position of maximum emission (λmax). (D) Spectral width (Γ) at half the peak intensity. (E) Log-normal asymmetry parameter (ρ). (F) Average emission wavelength <λ> using a window of emission from 310–370 nm. (G) Numerator of Eq. (13) using a window of emission from 310–370 nm. Solid line represents a linear fit to the data points and has a slope of −0.648. (H) Denominator of Eq. (13) using a window of emission from 310– 370 nm. Solid line represents a linear fit to the data points and has a slope of −0.655.

