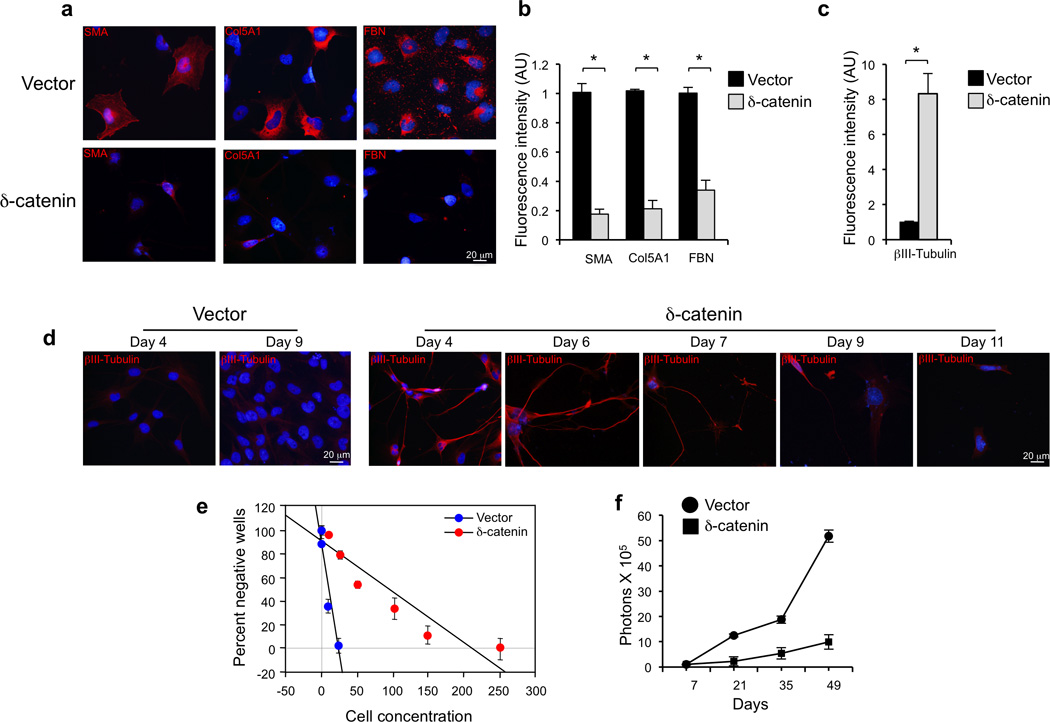
Figure 5.

Functional analysis of CTNND2 in mesenchymal GBM. a, Immunofluorescence for fibronectin, collagen-5α1 (COL5A1) and smooth muscle actin (SMA) in glioma spheres #48 four days after infection with lentiviruses expressing δ-catenin or the empty vector. Nuclei are counterstained with Dapi. b, Quantification of fluorescence intensity for SMA, COL5A1 and FBN for cultures treated as in a. n = 3 independent experiments; data indicate mean±SD. c, Quantification of fluorescence intensity for βIII-tubulin in cells #48 infected with lentiviruses expressing CTNND2 or the empty vector. d, Time course analysis of βIII-tubulin expression in glioma spheres #48 transduced with lentiviruses expressing CTNND2 or the empty vector. Note the loss from the advanced culture of βIII-Tubulin expressing cells. e, Linear regression plot of in vitro limiting dilution assay using GBM-derived cells #48 expressing vector or δ-catenin. The frequency of sphere forming cells was 7.42±1.16 and 0.88±0.02 for vector and δ-catenin, respectively (t-test, p = 0.0098). Error bars are SD. f, Longitudinal analysis of bioluminescence imaging in mice injected intracranially with GBM-derived line 48 expressing vector or δ-catenin. n = 3 mice for vector and 5 for δ-catenin. Symbols are the mean and bars are SEM of photon counts.
