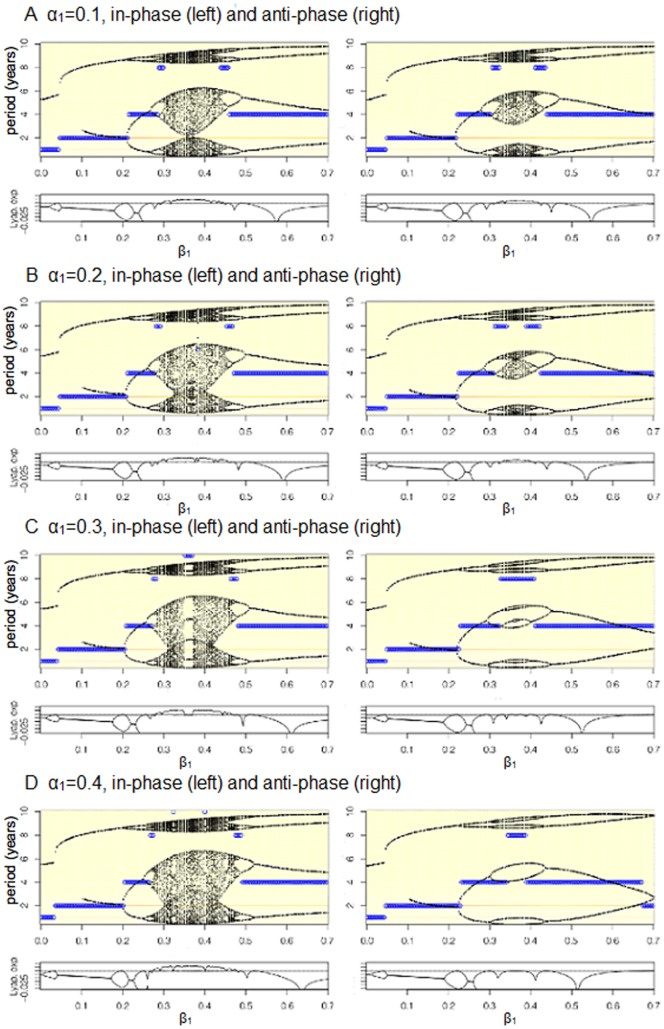
Figure 8. One-dimensional bifurcations of the effect of varying  values given different baseline values of
  (0.1, 0.2, 0.3, 0.4) and
  (in phase, anti-phase).
Black points represent the relative size of the epidemic peaks, blue circles represent the period of the attractor, while the background is a heat map of the the power spectral densities where the color red signifies higher power. In all of the figures, the presence of an annual and biennial component is always present even though, for instance, an attractor may have a period of four years. The bottom panel in each of the figures shows the main Lyapunov exponent, when the system bifurcates the Lyapunov exponent equals zero (touches the horizontal line), when the Lyapunov exponent is greater than zero the dynamics are said to be chaotic. ( = 30/1000,
  = 1000 in all panels).

