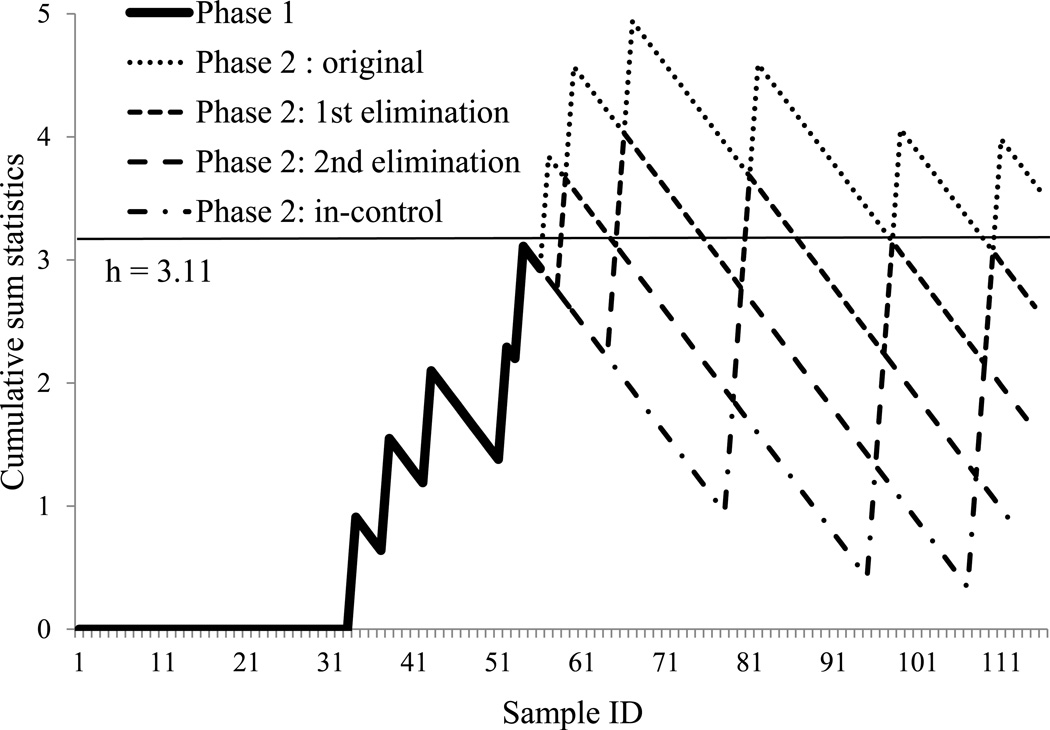
Figure 3.
Binomial cumulative sum control charts for 2010 and 2011 testis weight data. By 100% inspection, all testes that weighed less than 3 g were assigned a value of 1; all others were assigned a value of 0. The chart was set up with 2010 data as Phase 1, and the control limit (straight line) kept all Phase 1 in-control (no data set exceed the line). The tested 2011 data were Phase 2. The chart presented the approach of eliminating each first out-of-control point until all Phase 2 data were in-control. h: control limit.

