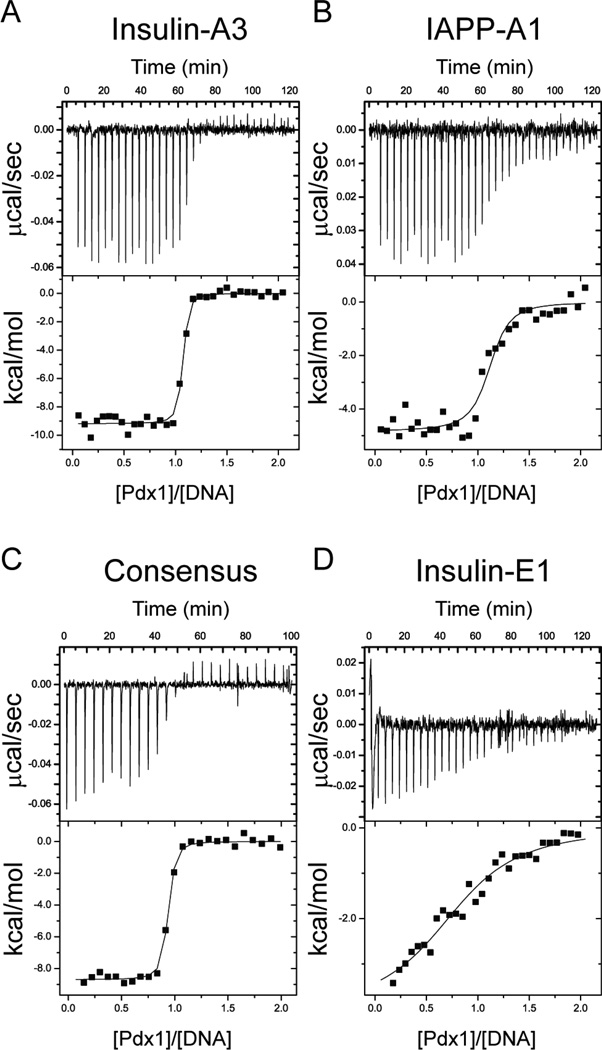
Figure 2.
Isothermal Titration Calorimetry (ITC) monitors the thermodynamics of Pdx1 interactions with natural and consensus DNA promoter elements. Representative power-response curves (top) and heats of reaction normalized to the moles of Pdx1 injected (bottom) are provided for the titration of Pdx1 into (A) Insulin-A3 DNA, (B) IAPP-A1 DNA, (C) Consensus DNA, and (D) Insulin-E1 DNA. All titrations were conducted at 298K in 100 mM cacodylate, pH 7.3, and 100 mM potassium chloride.

