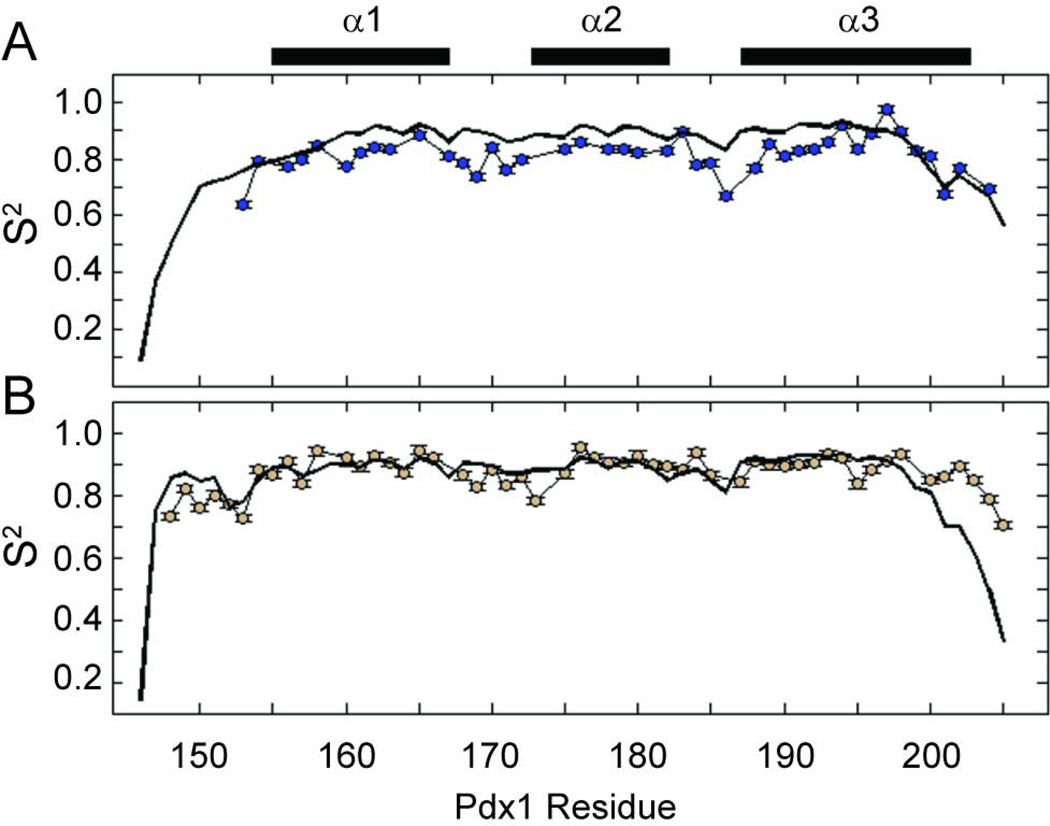
Figure 6.
Backbone amide generalized order parameters (S2) as a function of residue number for (A) apo-Pdx1 and (B) the Pdx1-DNACON complex. In both panels, the experimental order parameters are represented by colored circles attached with thin black lines, while those calculated from the Anton MD trajectories are represented as a thick black line. Experimental uncertainties in the order parameters are indicated as error bars, which often do not exceed the size of the markers on the plot. The secondary structure from the co-crystal of Pdx1 with a consensus DNA duplex is represented by bars above the figure.

