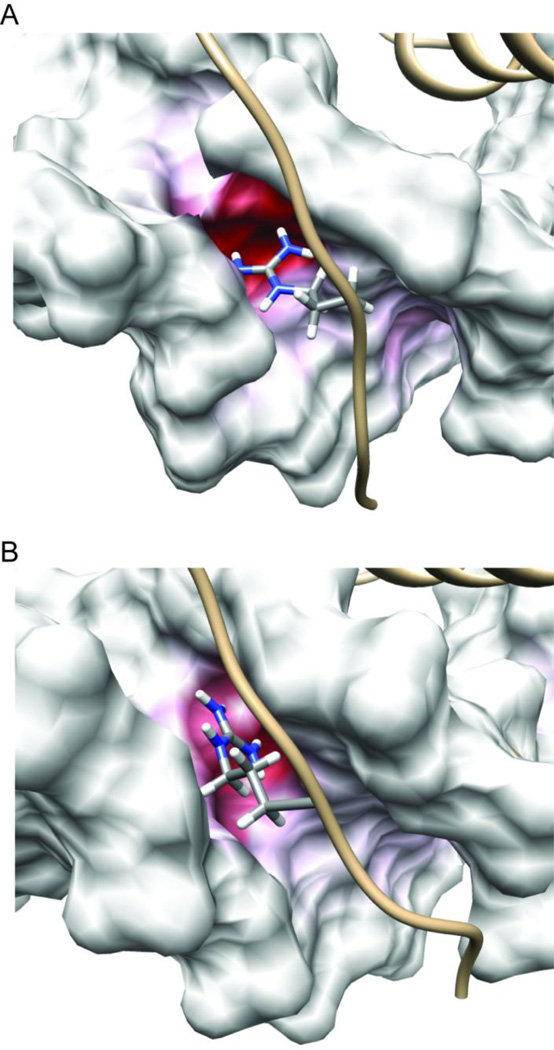
Figure 8.
The Arg-150 side chain δ-guanidino group inserts into a strongly negative patch within the minor groove of the DNA duplex and reorients to track the position of maximum negative charge. The surface electrostatic potential of the DNA, calculated with Pdx1 removed, is mapped onto snapshots from Anton MD trajectories of (A) the Pdx1-DNACON complex and (B) the Pdx1-DNA(TTAATG) complex. In both cases, the snapshot recorded after 3.5 µs of production dynamics is selected for representation. In order to emphasize the strong negative charge of the Arg-150 binding pocket, even compared with the general charge on a DNA duplex, the color scale of the DNA surface for both panels is −14 kT/e (red) to 0.0 kT/e (white). The side chain atoms of Arg-150 are represented in CPK mode, and colored by atom type (grey, carbon; blue, nitrogen; white, hydrogen).

