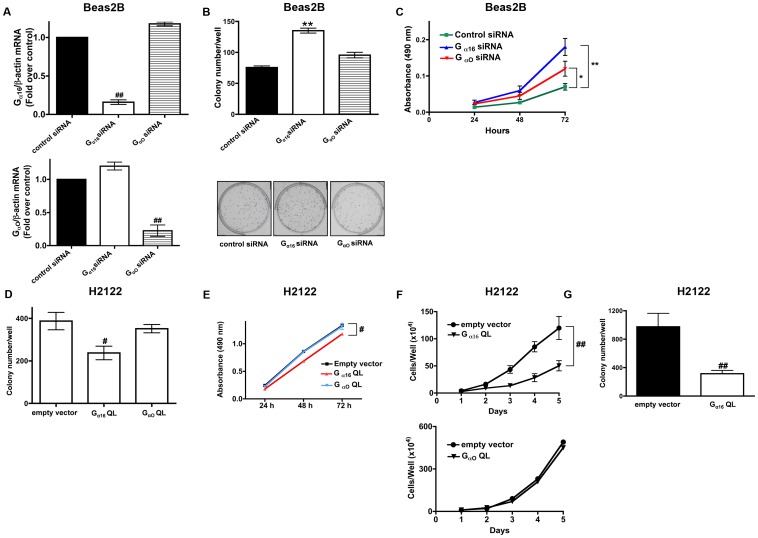
Figure 3. Gα16 regulates NSCLC cell proliferation.
A. Beas2B cells were transfected with either control siRNA or siRNAs specific to Gα16 or Gαo. Total RNA was isolated and analyzed for the expression of Gα16 or Gαo using quantitative PCR. Normalized Gα16 or Gαo mRNA levels to that of β-actin mRNA were represented in the graphs. ##, p<0.01; versus control siRNA. Beas2B cells were transfected with either control siRNA or siRNAs-specific to Gα16 or Gαo and cell proliferation rates were later determined either by using a clonogenic assay (B) or an MTS assay (C) as described in the Methods. Upper panel represents mean ± SEM from two independent highly reproducible experiments, while representative images were displayed in the lower panel. Data represents mean ± SEM from three independent highly reproducible experiments. *, p<0.05; **, p<0.01; versus control siRNA. H2122 cells were transfected either with empty vector or constitutively active Gα16Q212L or GαoQ205L expression vectors and the cell proliferation rates were later determined using either a clonogenic assay (D), an MTS assay (E) or five-day cell growth curve analysis (F) as described in the Methods. Upper panel represents mean ± SEM from two independent highly reproducible experiments, while representative images were displayed in the lower panel. Data represents mean ± SEM from three independent highly reproducible experiments. #, p<0.05; G, H2122 cells were transfected with either empty vector or constitutively active Gα16 Q212L and the abilities of the transfected cells to grow on soft agar were later probed. Data represents mean ± SEM from three independent highly reproducible experiments. ##, p<0.01; versus empty vector control.

