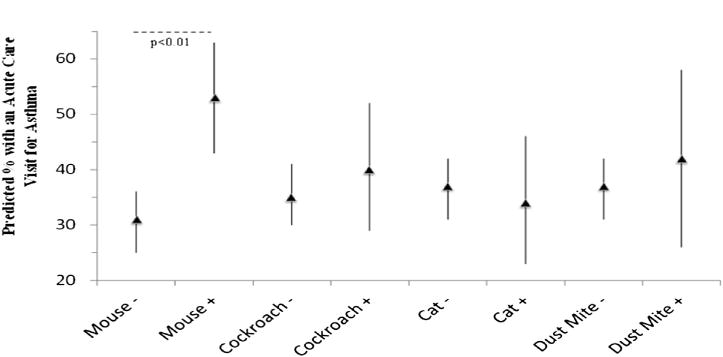
FIG 1.

Predicted percentage of subjects with an acute care visit for asthma over a 3-month period. Sensitization and exposure groups using exposure data from bed dust samples are plotted on the x-axis. Mouse − represents those without the combination of sensitization and exposure for mouse allergen, and Mouse + represents those with the combination of sensitization and exposure to mouse allergen. The same is true for each of the other allergens. The predicted percentage of subjects with an acute care visit over 3 months is plotted on the y-axis. Significant comparisons are labeled with P values.
