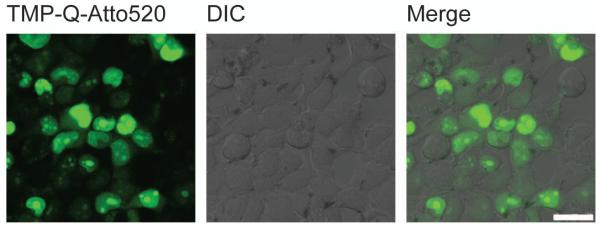
Figure 9.

Live cell imaging of H2B labeled with fluorogenic TMP-tag. The left image shows expected result of fluorescence imaging of H2B in live HEK 293T cells using TMP-Q-Atto520. The middle image is from differential interference contrast (DIC) channel. The right image is obtained by merging the fluorescein channel with the DIC channel. Scale bar is 25 μm.
