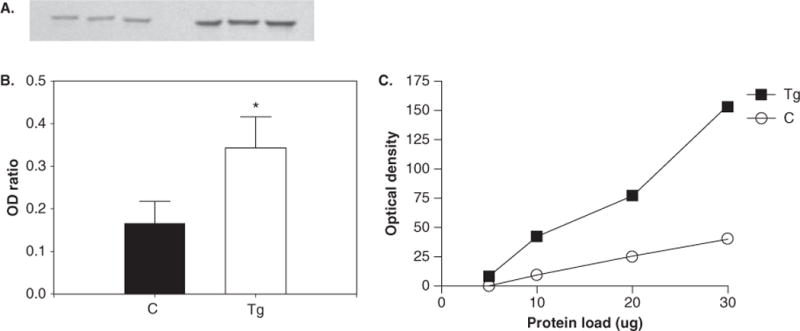
Figure 1.

Western blotting results for phosphorylated tyrosine hydroxylase. Blotting membrane (A) shows the intensity of band staining between control (left) and Tg (right) animals, and the ratio of band optical density (OD) of pTH to NSE (B). *Significant increase in the expression of pTH in Tg animals (P < .05). (C) Protocol optimization indicates that immunoreactivity is linear over a range of protein loading.
