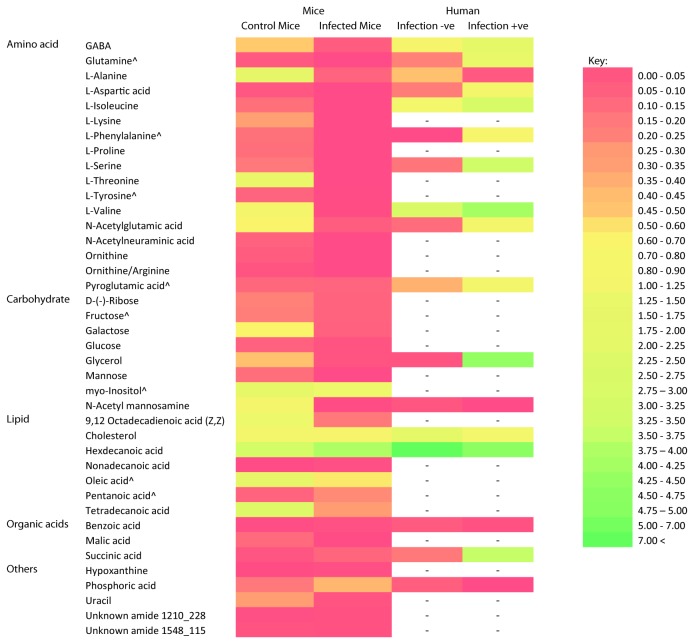
Figure 2. Faecal metabolites that contributed to the variance between infected and uninfected mice.
Metabolites contributing to the variance between faecal metabolite profiles of mice infected with C. parvum and the uninfected control mice were compared to metabolites which contributed to the variance of faecal metabolite profiles of humans infected and not infected with Cryptosporidium from Ng et al., (2012). Heat map was generated using the mean of normalized peak area of the metabolite. All mice faecal metabolites showed statistically significant (p < 0.05) contributions to the variance except for those denoted by ^, where p > 0.05.

