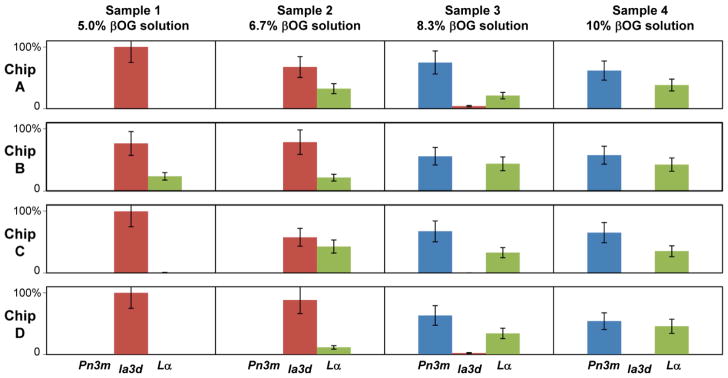
Figure 5.

Relative amounts of different phases in samples prepared and analyzed on-chip using four different microfluidic devices at 25 ± 1 °C. The amount of each phase was estimated from intensities of corresponding reflections in SAXS diffractograms. Relative amounts were obtained by normalizing data for each sample to yield the combined amount of all phases of 100%..
