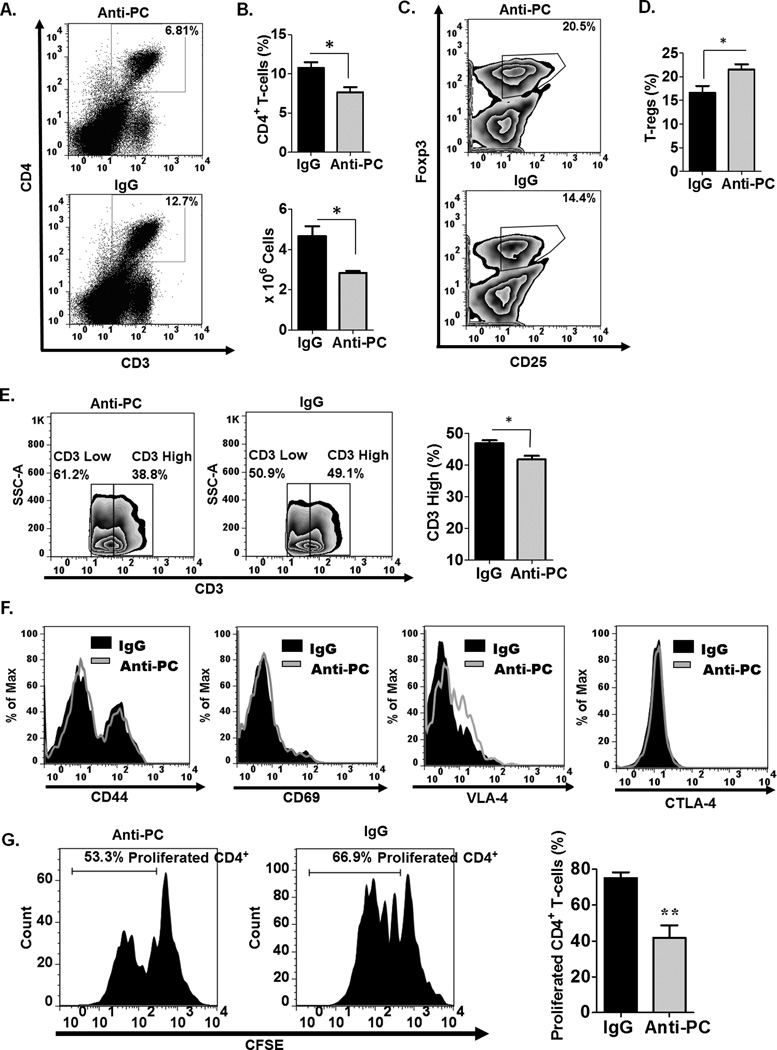
Figure 3. Peripheral CD4+ T-cells in anti-PC mice are significantly decreased and functionally deficient.
(A) The frequency of splenic CD4 + T-cells from anti-PC and control mice was examined by flow cytometry at day 17 following EAE induction. Data are represented as flow cytometric dot plots. (B) The upper panel shows the graphical representation of the mean percentage of splenic CD4+ T-cells, and the lower panel shows the absolute cell counts of splenic CD4+ T-cells, respectively. Data are represented as means ± SEM (control n = 6; anti-PC n = 4; * p < 0.05 by Student t test). (C) The frequency of splenic T-regs (CD4+, CD25+, Foxp3+) among CD4+ T-cells was assessed by flow cytometry. Data are shown as cytometric contour plots (gated on CD3+CD4+). (D) The percentages of T-regs among CD4+ T-cells in the periphery are shown as means ± SEM (control n = 6; anti-PC n = 4; * p < 0.05 by Student t test). (E) CD3 expression on splenic CD4+ T-cells was assessed by flow cytometry. Data are shown as flow cytometric contour plot on the left (gated on CD3+ cells), and right panel shows the percentage of CD3high splenocytes from both groups. Data are shown as means ± SEM (n > 3; * p < 0.05 by Student t test). (F) The cell surface expression of CD44, CD69, VLA-4 and CTLA-4 on splenic CD4+ was assessed by flow cytometry. Expression levels are presented as histograms. (G) Splenocytes from control and anti-PC mice were labeled with CFSE and cultured in vitro. T-cells in whole splenocyte culture were stimulated with plate-bound anti-CD3 and soluble anti-CD28 for 96 hours. The proliferative capacity of CD4+ T-cells was assessed by flow cytometry based on CFSE dilution. Left panels show the histogram representation of CFSE labeled CD4+ T-cells from both experimental groups (gated on CD4+ cells). Data on right panel are the graphical representation of the percentage of CD4+ T-cells that have proliferated based on CFSE dilution. Data represented as means ± SEM (n=4; ** p < 0.01 by Student t test).

