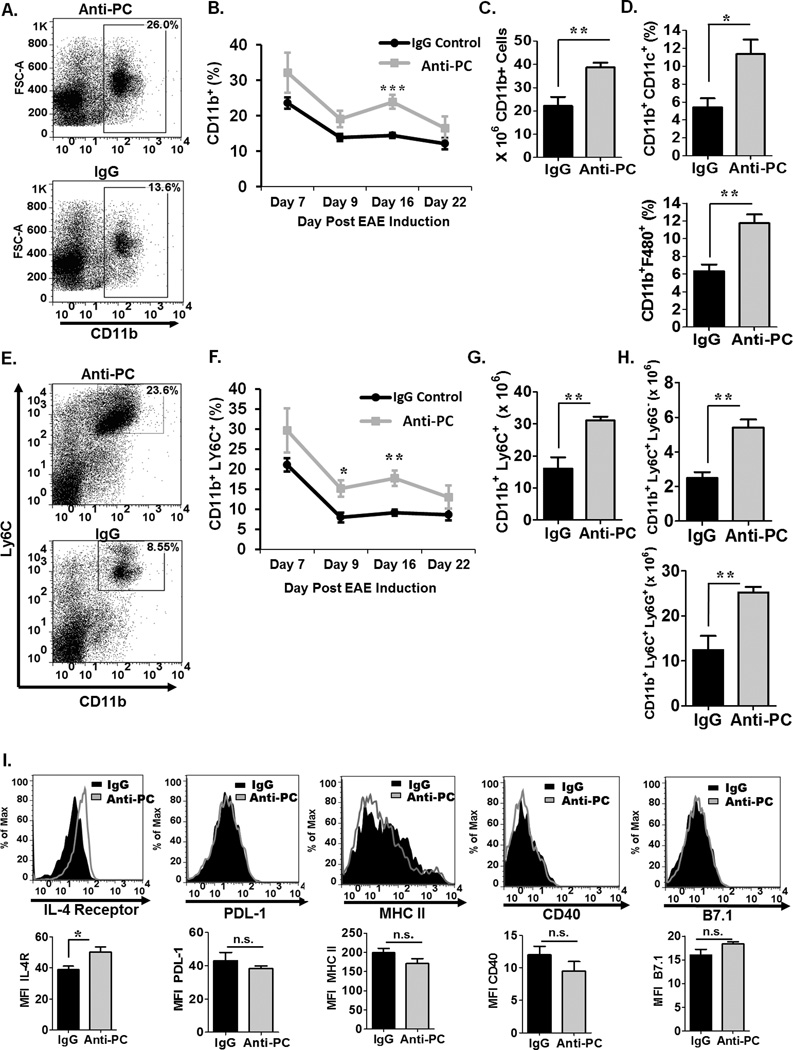
Figure 4. CD11b+ cells in the periphery of anti-PC mice are significantly increased.
(A) Splenocytes were harvested from the anti-PC and IgG mice at day 17 following EAE induction, and the frequency of CD11b+ was assessed by flow cytometry. Data are presented as flow cytometric dot plots. (B) The frequency of splenic CD11b+ cells in anti-PC or IgG mice at various stages of EAE progression was assessed by flow cytometry. Data are presented as means ± SEM (n > 3, ** p < 0.001 by Student t test ). (C) The absolute cell counts of splenic CD11b+ cells from both groups are presented as means ± SEM (n > 3, ** p < 0.01). (D) Splenocyte frequency of specific Cd11b + subsets, namely macrophages (CD11b+ F480+) (upper panel) and DC’s (CD11b+ CD11c+) (bottom panel), was examined by flow cytometry. Data are presented as means ± SEM (n > 3, p * < 0.05 * p < 0.001 by Student t test ). (E) The frequency of splenic MDSCs was examined by staining for cell surface markers, CD11b and Ly6C. Frequencies were analyzed by flow cytometry. Data are represented as flow cytometric dot plots. (F) The frequency of splenic MDSCs in anti-PC or IgG mice at various stages of EAE progression was assessed by flow cytometry. Data are presented as means ± SEM (n > 3, * p < 0.05, ** p < 0.001 by Student t test ). The absolute cell counts of (G) splenic MDSCs and the two (H) MDSC subsets from both groups are presented as means ± SEM (n > 3, ** p < 0.01). (I) The expression of cell surface markers on splenic MDSCs were assessed by flow cytometry. Expression levels are presented as histograms (upper panel) and as means ± SEM (lower panel, n > 3, * p < 0.05).

