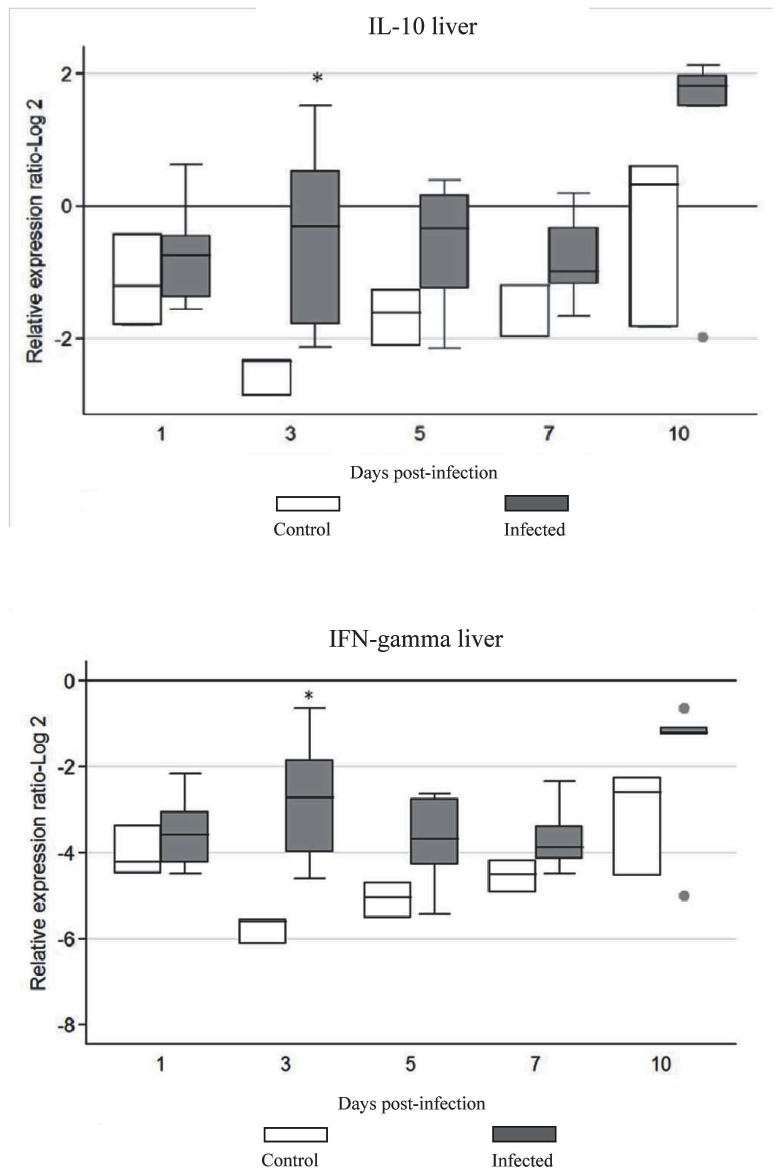
Figure 3. Cytokine mRNA expression in liver of chickens infected with FAdV-4.
The groups were: uninfected (negative control), and FAdV-4 infected chickens using im inoculation. Target and reference gene expression was quantified by real-time RT-PCR using SYBR Green. Target gene expression is presented relative to β-actin expression and normalized to a calibrator. The results are diagrammed as whisker boxes with medians. Boxes represent interquartile ranges and whiskers indicate extreme values. The difference in cytokine expression between groups was assessed by Mann-Whitney test and comparisons were considered significant at P≤0.05 (*).● symbols represent values which were identified as outliers.

