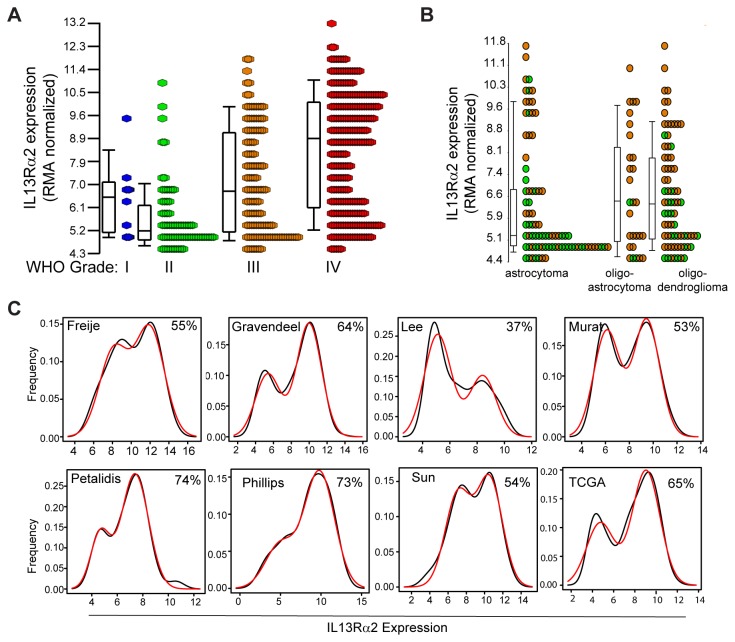
Figure 1. Expression of glioma IL13Rα2 with respect to tumor grade and histological sub-type.
(A) Comparison of IL13Rα2 gene expression levels (robust multichip average, RMA) versus glioma tumor grade (WHO grades I-IV) from a combined data set of 429 patient samples [20,24]. The level of IL13Rα2 expression is 3.5-fold higher for WHO grade IV patients as compared to all other patients (2-way ANOVA with linear contrast, p=1.5 x 10⁻⁹). Shown are box plots marking median (bar), 25th and 75th percentiles (box), and 10th and 90th percentiles (error bars). (B) Comparison of IL13Rα2 gene expression levels for 184 samples [20,24] segregated based on glioma WHO grade II (orange circles) and grade III (green circles), and histological sub-types: astrocytoma, oligoastrocytoma and oligodenroglioma. No significant difference in IL13Rα2 expression levels were observed for the three patient cohorts (p=0.83, 2-way ANOVA). Box plots define percentiles as in (A). (C ) Biomodal distributions of IL13Rα2 for GBM (WHO IV) as defined by eight gene-array studies [5,6,19-25] (black line). Reported for each study is the frequency of tumors over-expressing IL13Rα2 estimated using a non-linear least squares regression (red line) .

