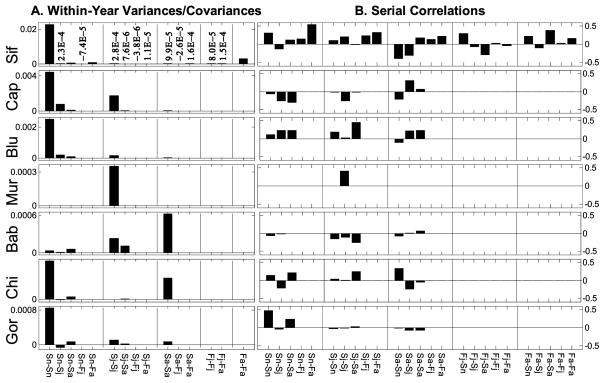
Figure 2.
Process variances, covariances, and serial (between-year) correlations for pairs of vital rates shown at the bottom. A, The first bar in each group is the variance of the specified rate, and subsequent bars are covariances between that rate and the other rates. Nonzero variances and covariances that are too small to be visible at the scale of the Y-axis are written in scientific notation. B, The correlation between the first vital rate of a pair in year t and the second vital rate in year t + 1. All measures of variability are based on vital rate estimates that have been corrected for sampling variation. Sif = sifaka, Cap = capuchin, Blu = blue monkey, Mur = muriqui, Bab = baboon, Chi = chimpanzee, Gor = gorilla. Sn is the probability that a newborn survives to the first census after its birth; Sj and Sa are the probabilities of survival over 1 year for juveniles and adults, respectively; and Fj and Fa are the mean number of daughters produced by a juvenile or adult female, respectively, during the following year.

