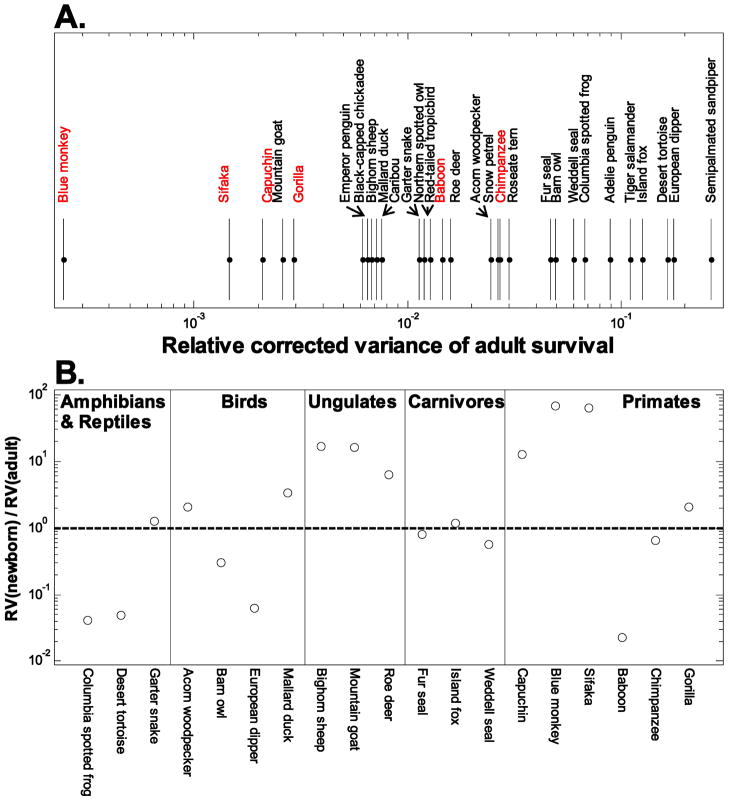
Figure 4.
Levels of temporal variability in survival for primates estimated in this study compared with published values for other vertebrates. A, Process variance in survival of adults relative to its maximum possible value given mean survival. Primates are shown in red. Note that relative process variance is shown on a one-dimensional logarithmic scale. B, The ratio (log scale) of relative process variance of newborn survival (RV(newborn)) to relative process variance of adult survival (RV(adult)) for all studies that provided nonzero estimates of both process variances. The horizontal dashed line indicates equal relative process variances for the two survival rates; points above the line therefore show higher relative variability in newborn survival than in adult survival. Muriqui is not included, because the estimated process variance in survival was zero for both newborns and adults. Details of literature estimates are provided in appendix B.

