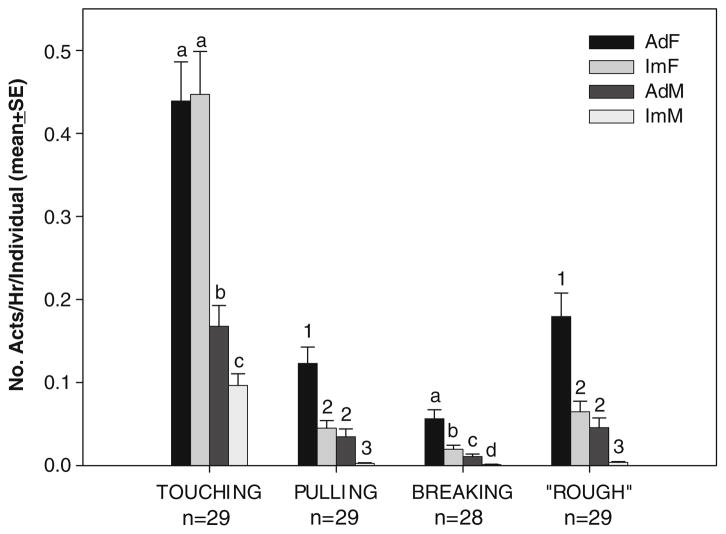
Fig. 1.
Mean (±SE) hourly rate of infant handling interactions per potential partner. This value was obtained by dividing the hourly rate of interactions of each type by the number of potential partners of each age/sex category present in the group. The rate of “rough” handling represents the sum of the rate of pulling and contact breaking. Letters and numbers indicate where values differ significantly among age sex classes (when symbols are not shared among classes) and where they do not (when symbols are shared) for a given handling behavior, based on repeated applications of paired-samples t tests. Numbers below the interactions represent the sample size of infants

