
Figure 8.
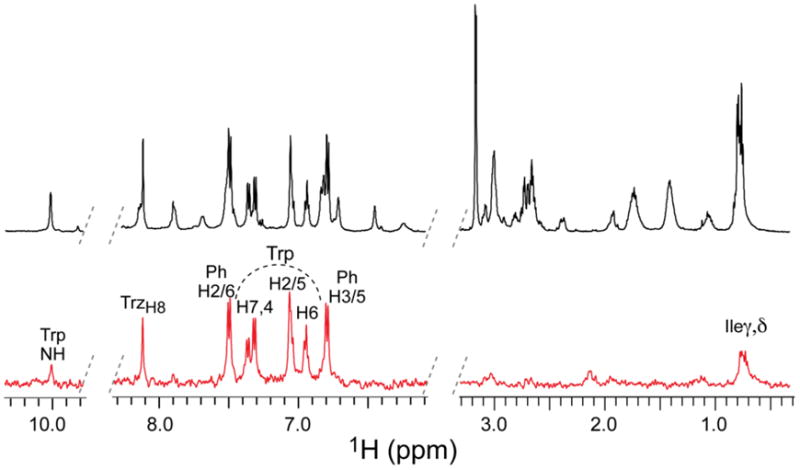
STD NMR spectrum of UM25. Reference and difference spectra (see Materials and Methods) are shown in black and red, respectively (see Materials and Methods). Protons exhibiting the largest enhancements are labeled (see Table 2 for quantification). Protons of Trp are located under the curved, dotted line. Trz and Ph denote the triazole and p-aminophenyl rings, respectively (see Figure 9).