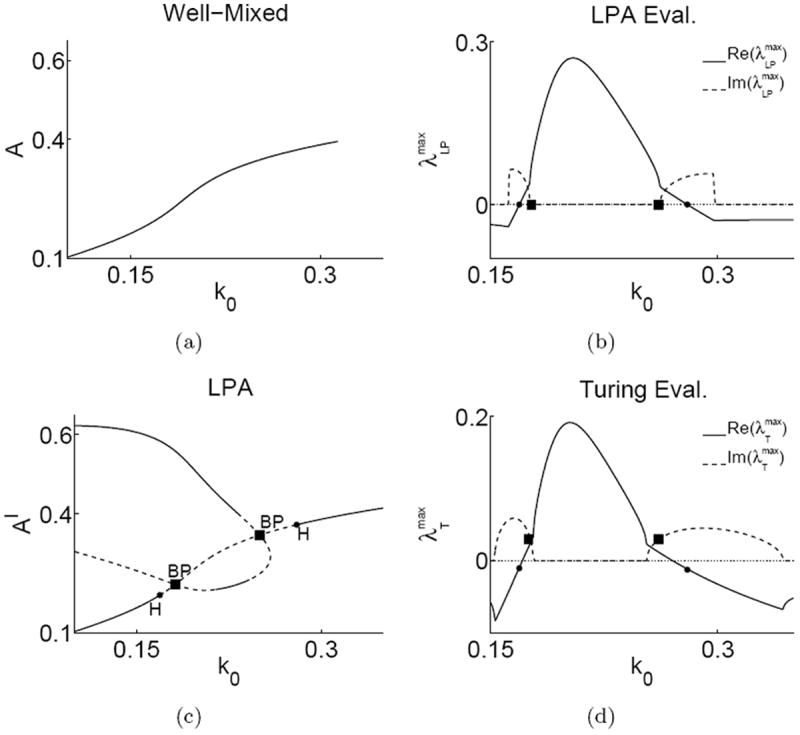
Figure 2.

Bifurcation analysis and eigenvalues in the actin-wave model for s1 = 0.7, s2 = 0.7, ε̃ = 0.1 and other parameters at default values. Left panels: Analysis of well mixed (a) and LPA (c) ODE’s plotting steady states of A and Al respectively versus the basal activation rate k0 (Solid = stable, dashed = unstable). The well-mixed model has a single stable steady state (a). The LPA system (c) has the same global branch, and additional local branches. ■, BP = branch points, ●, H = Hopf bifurcation. Right panels: A comparison of maximal (with largest real parts) LPA (b) and Turing (d) eigenvalues versus k0. (Solid = real, dashed = imaginary parts). Symbols ■, ●, mark the corresponding k0 values in (c). Hopf points correspond to zero real part and branch points to zero imaginary parts of . The eigenvalues in (b) and (d) are similar and the Hopf and BP bifurcations closely relate to bifurcations of the RDE model.
