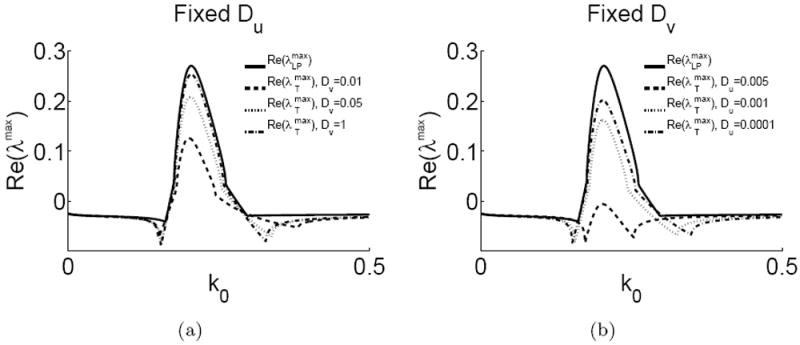
Figure 3.

In the limits (a) Dυ (i.e. DI) → ∞, (b) Du (i.e. DA) → 0, Turing maximal eigenvalues (dashed and dotted) approach LPA eigenvalues (solid). The real parts of λmax is plotted against k0. In the given limits, the LPA and Turing eigenvalues agree well.
