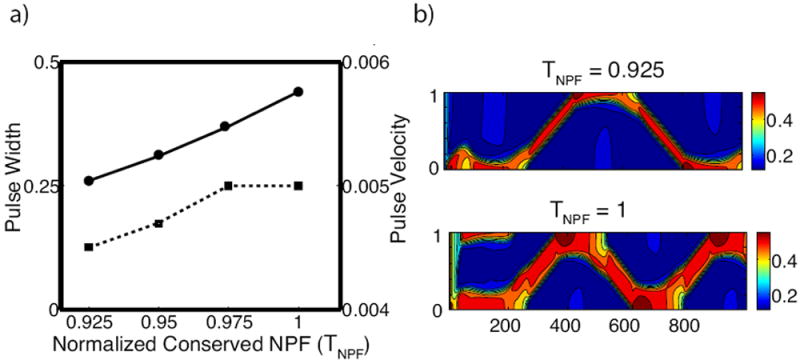
Figure 7.

The effects of the total amount of regulatory protein TN P F on pulse propagation. (a) Pulse width (solid) and velocity (dashed) as a function of TN P F. (b) Intensity plot of A at the two endpoints TN P F = 0.925, 1 respectively. Parameters are k0 = 0.15, s1 = 0.7, s2 = 0.6 with all others as in Table 1.
