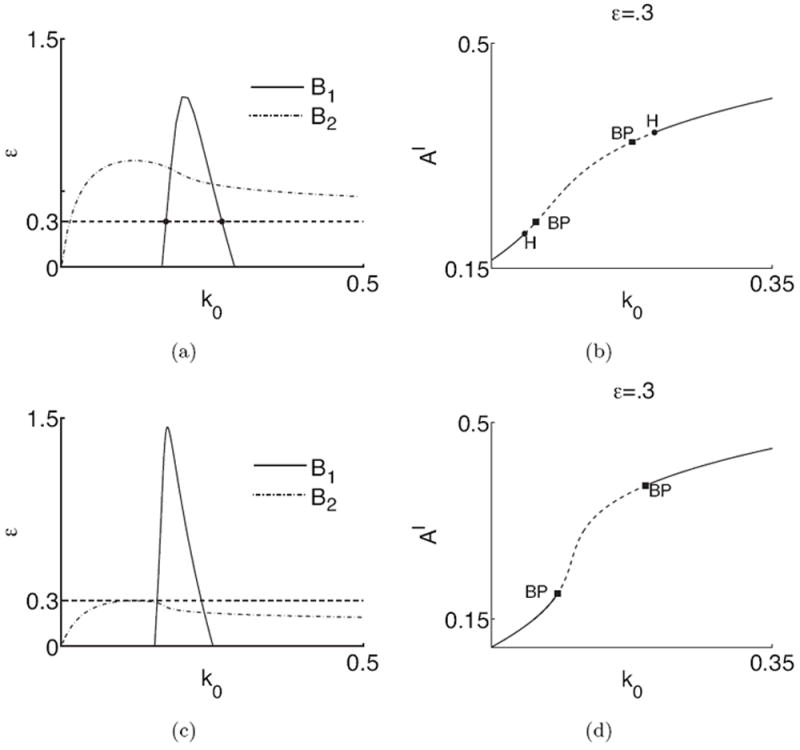
Figure 8.

The timescale of F-actin dynamics affects the presence and locations of Hopf bifurcations in the LPA system and oscillatory dynamics in the original RDEs. Left: Plot of B1(k0) and B2(k0) of (10) for (a) s1 = s2 = 0.7, (c) s1 = 0.9 and s2 = 0.3 (Other parameters as in Table 1). Horizontal dashed lines are values of ε corresponding to LPA diagram (b,d). Hopf bifurcations correspond to (k0, ε) values on the B1 curve below B2. Points on the B1 curve above B2 represent saddles. Heavy dots on the B1 curve in (a) correspond to Hopf points in (b). In (b,d), we show LPA bifurcation plots for the parameter sets corresponding to (a,c) respectively with ε = 0.3.
