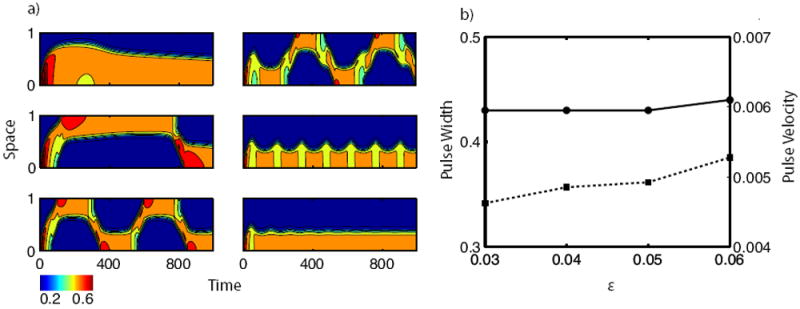
Figure 9.

The effect of the refractory feedback rate ε. (a) Intensity plots of A. The ε values from top to bottom, left to right are 0.001, 0.01, 0.05, 0.11, 0.19, 0.29. Other parameters as for reflecting pulses in Table 1. (b) Pulse width (solid) and velocity (dashed) as a function of ε for reflecting waves.
