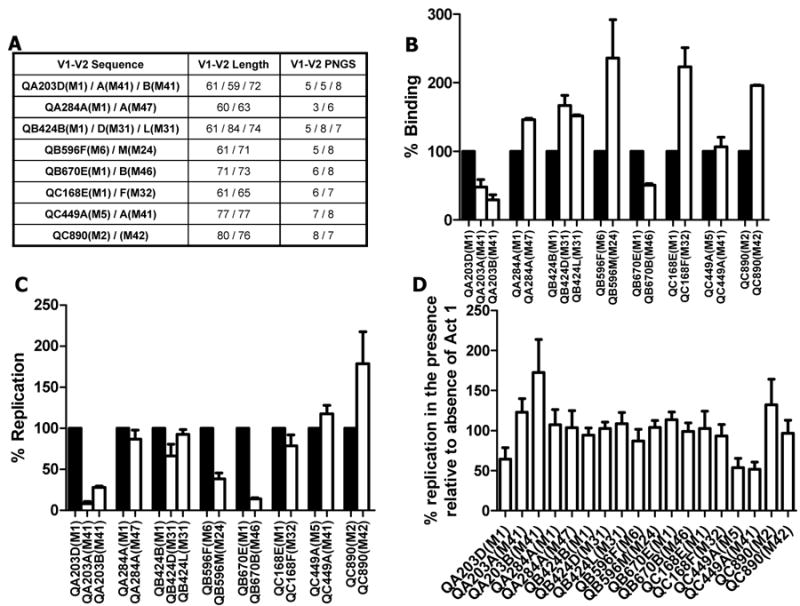
Figure 2.

Influence of longitudinal V1-V2 loop changes on α4β7 utilization. A, Table lists the V1-V2 loop ID, length and number of predicted N-linked glycosylation sites (PNGS). In each V1-V2 loop name, the first part lists the subject ID. The duration (in months) from estimated acquisition date to the time of sample collection from which the V1-V2 loop was obtained is indicated in the brackets of each V1-V2 loop name. The envelope sequences have been described in detail previously.6, 15 B and C, Attachment to CD8+ T cells (B) and replication in CD4+ T cells (C) among early (black bars) and chronic (white bars) infection V1-V2 envelope loop chimeras. In each experiment, percent binding and replication is calculated relative to the envelope chimera with the early infection V1-V2 loop (set at 100%). D, Percent replication in the presence relative to the absence of 10 ug of Act 1. Bars show mean values with standard error generated from a minimum of 3 and 6 independent binding and replication experiments respectively. In each independent experiment, cells were obtained from different donors.
