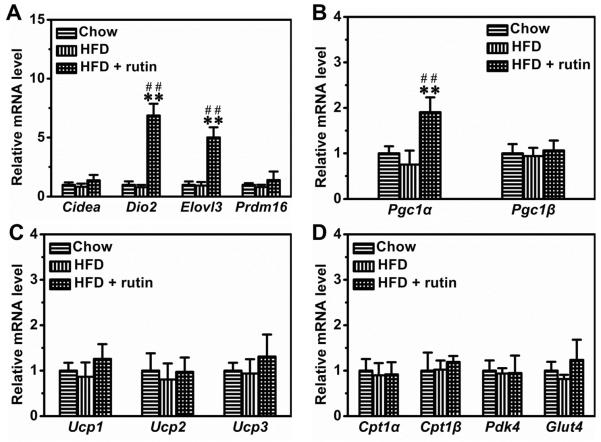
Figure 7. Rutin-mediated modulation of gene expression in BAT of mice fed a HFD.
(A) Relative mRNA level of BAT signature genes (n = 4, ** P < 0.01 vs mice fed with regular chow; ## P < 0.01 vs mice fed with HFD). (B) – (C) Relative mRNA level of genes involved in energy expenditure (n = 4, ** P < 0.01 vs mice fed a regular chow; ## P < 0.01 vs mice fed a HFD). (D) Relative mRNA level of genes involving glucose and lipids metabolism.

