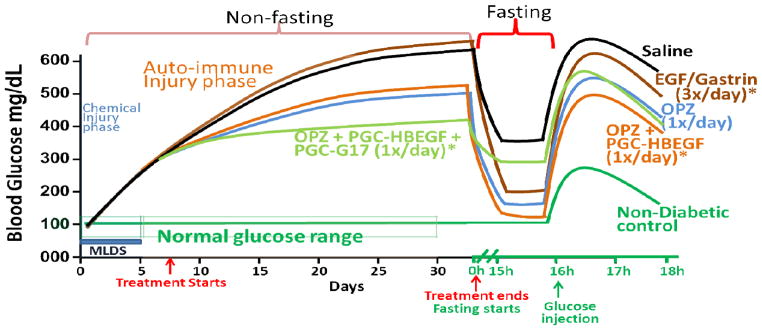
Figure 4.

Diagram of the in vivo Blood Glucose level during and after the indicated treatment of multiple low dose streptozotocin diabetic mice. The diagram was derived from the best fit curve of the data and is for illustrative purposes only. CD1 mice (n=8/group; n=5/group for IPGTT) were treated with multiple low dose Streptozotocin (40mg/Kg daily for 5 days) to induce chemical injury followed by auto immune injury. PGC-HBEGF and HBEGF alone are similar to saline (not shown). Asterisks indicate susceptibility to hyperglycemic effect of HBEGF (17) during treatment while enhancing islet recovery. Proper evaluation of the effect of HBEGF containing treatment must be by FBG, IPGTT, and Histology after the treatment ends. It appears that too much gastrin improves blood glucose during treatment but can limit islet recovery based on FBG.
