
Figure 8. The effects of carbachol (CCh) on the unitary (u)EPSC failure rate at PC–FSN synapses during gamma frequency activity are consistent with presynaptic cholinergic modulation.
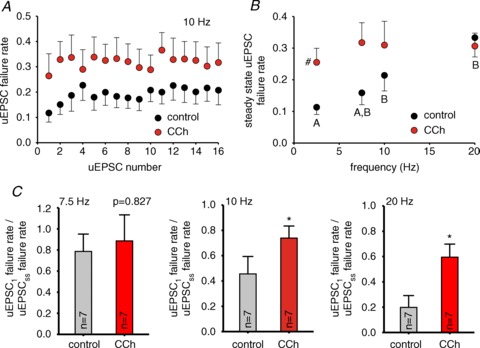
A, uEPSC failure rate during the trains at 10 Hz in control and 10 μM CCh. Data are mean ± SEM (n= 7). B, uEPSC failure rate at the steady-state from experiments as shown in A for 7.5, 10 and 20 Hz trains in control and 10 μM CCh. The steady-state failure rate values at 2.5 Hz are the failure rates of the first uEPSC of the trains. For 7.5, 10 and 20 Hz the steady-state failure rate was computed by averaging the failures for the last three uEPSCs in the trains. Results are mean ± SEM, #P < 0.05 control vs. CCh at the same frequency. For control values, individual groups not sharing the same upper case letter are significantly different, P < 0.05 post hoc comparisons with Tukey test. RM-ANOVA (control vs. CCh: F1,38= 7.754, P= 0.008; control vs. frequency: F3,38= 3.183, P= 0.035; CCh vs. frequency: F3,38= 0.658, P= 0.583).C,relative failure rate during the trains (failure rate of the first uEPSC of the train over the uEPSC failure rate in the steady-state) in the absence (control) and presence of 10 μM CCh (CCh) for7.5, 10 and 20 Hz trains. Data are shown as mean ± SEM, *P < 0.05 (paired t test).