
Figure 4. Repetitive firing.
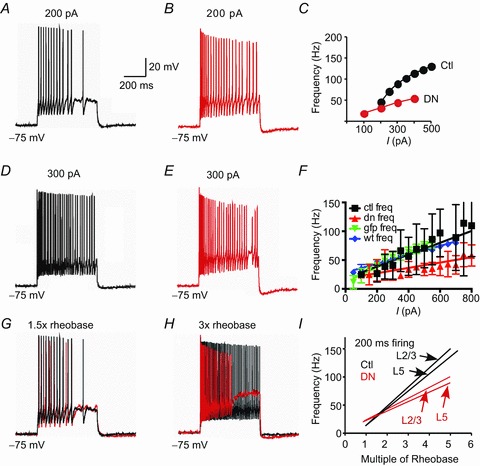
A, voltage trace in response to 200 pA current injection (500 ms) in a non-transfected layer 5 pyramidal cell. B, response of Kv2.1 DN transfected cell in same slice and layer as A (200 pA step current injection). C, plot of average firing frequency vs. injected current (I) for the cells shown in A and B. Note faster firing and steeper f–I slope in non-transfected (Ctl) cells (black circles) vs. Kv2.1 DN (red circles). D, response of same cell as in A to a larger (300 pA) current injection. Note faster firing vs. A. E, response of same Kv2.1 DN cell as in B to 300 pA current injection. Note faster initial firing vs. B, followed by a decline in spike height and eventual spike failure. F, plot of average firing frequency vs. injected current (I) for 12 pairs of non-transfected (Ctl) and Kv2.1 DN cells, as well as GFP alone (n= 7 cells) and Kv2.1 WT (n= 8 cells). Note lower slope (gain) and slower firing in the Kv2.1 DN cells (red). G, response of same cells as in A and B to a current injection at 1.5× rheobase. The non-transfected trace is black and Kv2.1 DN trace is red (there was little difference between the cells at this current). H, response of same cells in A and B to a larger current injection (3× rheobase). Same colour scheme as in G. Note depolarized Vm during ISIs and spike failure in the Kv2.1 N cell. I, plot of average firing frequency vs. multiple of rheobase. We compared non-transfected vs. Kv2.1 DN cells separately for layers 2/3 and for layer 5. In each case, the Kv2.1 DN cells fire slower and gain is lower. Individual data points are not included for clarity.