
Figure 5. Spike frequency adaptation.
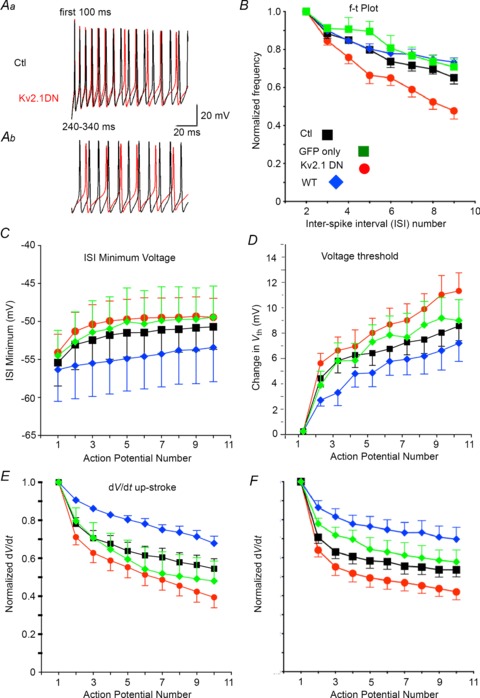
A, repetitive firing from the same cells as in Fig. 4A and B for the time epochs indicated. Non-transfected (Ctl) trace is black and Kv2.1 DN trace is red. Aa, Firing is similar initially. The Kv2.1 DN trace becomes more depolarized during ISIs and firing slows towards the end of the first 100 ms of firing. Ab, firing in the same cells at 240–340 ms after initial current injection. Note the depolarized ISI and voltage threshold, slowed firing, and reduced spike amplitude in the Kv2.1 DN cell. B, plots for instantaneous firing frequency (1/ISI) normalized to the second ISI and as a function of ISI number. Experimental groups are indicated by colour (inset in E). Non-transfected (Ctl) cells are shown in black, cells transfected with GFP alone in green, Kv2.1 DN cells in red and cells with overexpressed Kv2.1 WT in blue. While GFP alone or Kv2.1 WT caused no significant change in this relationship, the Kv2.1 DN group showed a significantly greater decrease in firing frequency with increasing spike number (spike frequency adaptation: SFA). C, population data for the minimum voltage attained during the ISI for non-transfected and Kv2.1 DN cells as a function of spike number during firing (at 3× rheobase). The ISIs became more depolarized with successive spikes and this change was greater in Kv2.1 DN cells. D, spike voltage threshold became more depolarized with spike number and this effect appeared more pronounced in Kv2.1 DN cells vs. non-transfected control cells. E, the maximum rate of rise for the spike (dV/dt) decreased with spike number during firing and this effect was magnified in the Kv2.1 DN cells (P= 0.04). The difference between the Kv2.1 DN and Kv2.1 WT groups was significantly different (ANOVA and post-hoc Tukey's multiple comparisons test). F, the maximum rate of decay for the spike (dV/dt) slowed during firing and this effect was magnified in the Kv2.1 DN cells (P= 0.04). The difference between the Kv2.1 DN and Kv2.1 WT groups was significantly different (ANOVA and post-hoc Tukey's multiple comparisons test).