
Figure 7. Trains of APs elicited at 50 Hz with 10 ms suprathreshold current injections.
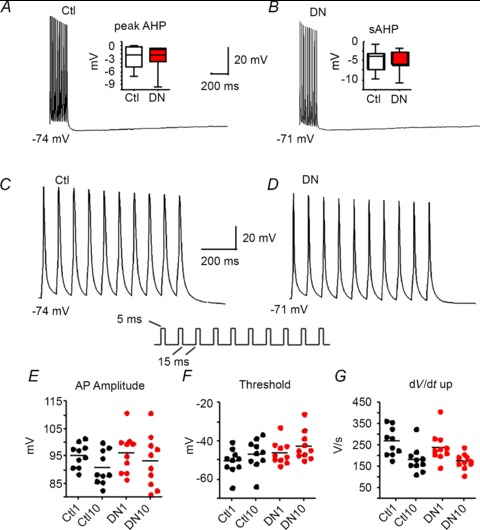
A, a train of APs in a non-transfected (Ctl) layer 5 pyramidal cell elicited by 10 APs at 50 Hz and shown with a slow time base to emphasize the afterhyperpolarization (AHP) following the spikes. Inset, box plot showing no differences in the peak AHP between non-transfected and Kv2.1 DN cells for this protocol (no significant differences). B, a train of APs elicited by 10 APs at 50 Hz in a cell transfected with the Kv2.1 DN in layer 5 of the same slice as cell in A. Inset, box plot showing no differences in the slow AHP (sAHP: measured at 500 ms) between non-transfected (Ctl) and Kv2.1 DN cells for this protocol (no significant differences). C, AP train shown in A except with expanded time scale. Inset, stimulus protocol. D, AP train shown in B except with expanded time scale. E, peak AP amplitude for the first and 10th AP compared between non-transfected (Ctl) and Kv2.1 DN cells. There were no differences between groups for the initial AP, the 10th AP or the changes between APs 1 and 10. F, AP voltage threshold for the first and 10th AP compared between non-transfected (Ctl) and Kv2.1 DN cells. There were no differences between groups for the initial AP, the 10th AP, or the changes between APs 1 and 10. G, AP rate of rise (dV/dt up) for the first and 10th AP compared between non-transfected (Ctl) and Kv2.1 DN cells. There were no differences between groups for the initial AP, the 10th AP, or the changes between APs 1 and 10.