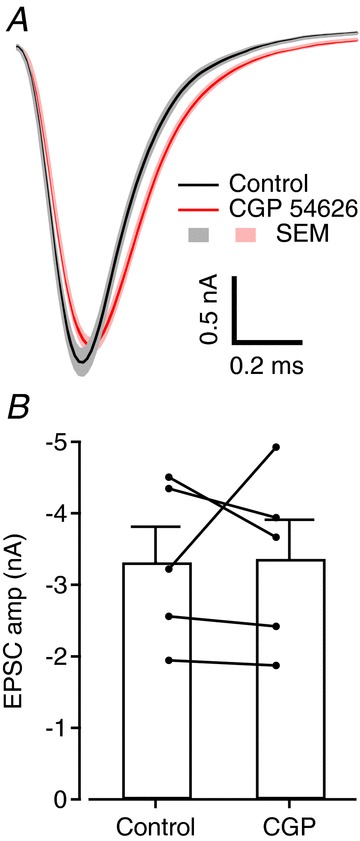
Figure 8. Low ambient GABA concentration in slices of the auditory brainstem.

A, average EPSCs recorded from one cell in control conditions (black) and in the presence of 10 μm CGP54626 (red); light colours represent ± SEM. B, bar chart showing average EPSC amplitude measured in five cells before and after perfusion of CGP. Filled circles are cell averages and error bars represent SEM.
