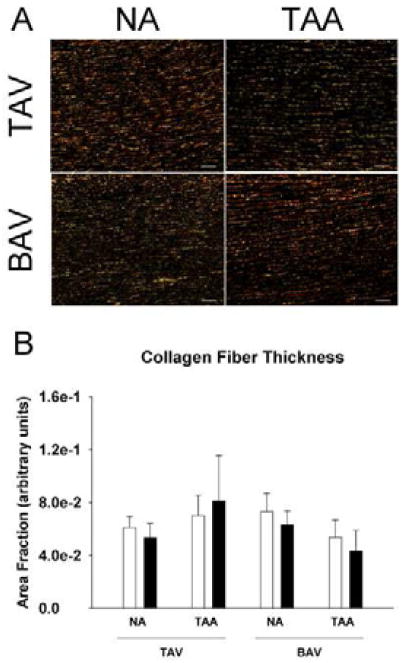
Figure 4.
Picrosirius red staining for collagen fibers in ascending aorta. A) Representative micrographs of aortic specimens imaged using linear polarized light showing thinner (green) and thicker collagen fibers (red). Images were oriented such that the adventitial side is located at the top and intimal side on the bottom. Scale bar=100 μm. B) Quantification of the area fraction of green (open bars) and red (solid bars). Bars represent mean ± SEM, n=3 (TAV-NA), 4 (TAV-TAA) and 5 (BAV-NA, BAV-TAA).

