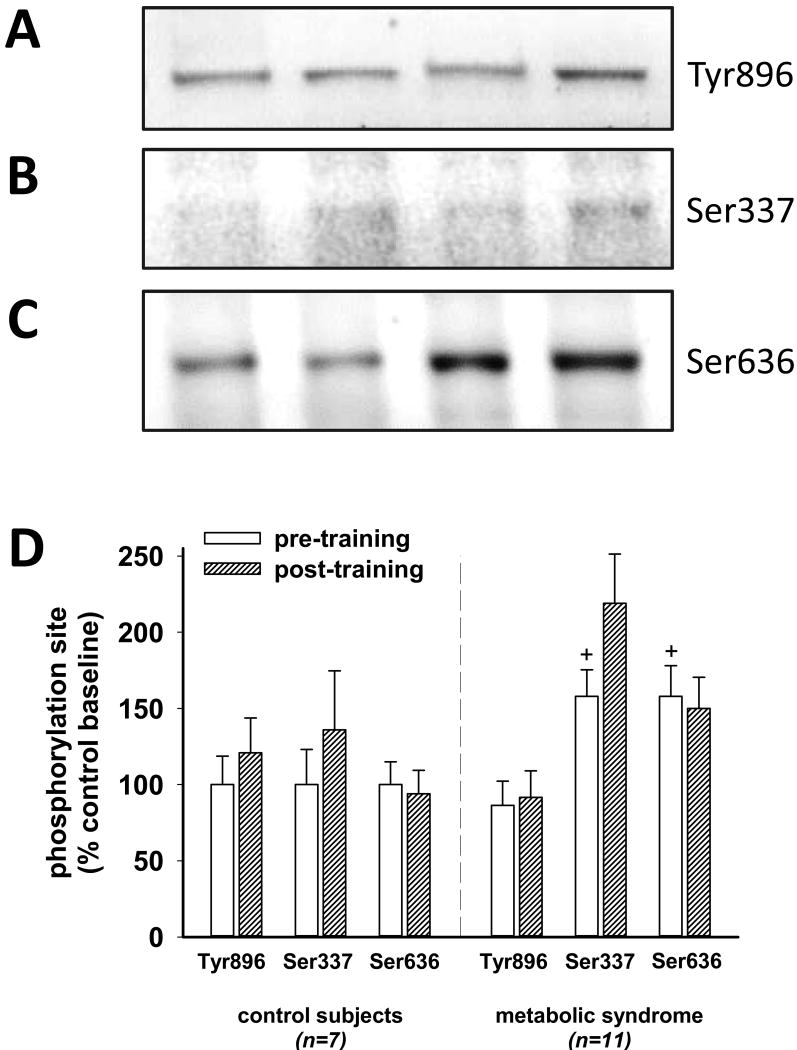
Figure 5. Cycle training impact on tyrosine and serine phosphorylation of muscle IRS-1.
Panels A, B, and C show typical immunoblot images of muscle homogenates probed with antibodies specific for phospho-Tyr896, phospho-Ser337, and phospho-Ser636, respectively. Immunoblot images like these were evaluated for signal strength using digital analysis software for each subject in four separate experiments. Panel D summarizes the results of these analyses. In the pre-training samples, Tyr896 phosphorylation was not different, but phosphorylation at Ser337 and Ser636 were about 50% higher in the metabolic syndrome muscle samples. The exercise training protocol did not decrease the amount of phosphorylation at Ser337 or Ser636, and there appears to be a trend toward increased phosphorylation at Ser337 in both controls and metabolic syndrome muscle. The plus sign on the graph indicates a difference from the corresponding control subject data (p<0.05).

