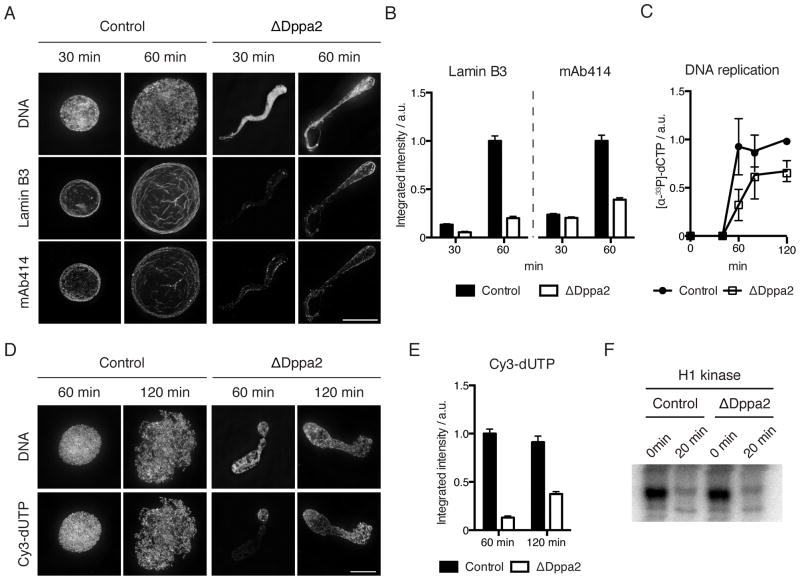
Figure 2. Dppa2 depletion compromises nuclear envelope integrity and leads to disorganized DNA replication.
(A) Visualization of lamin B3 and nuclear pore complexes (mAb414) by immunofluorescence.
(B) Quantification of integrated fluorescence intensity from (A). Bars represent mean and standard error from > 30 nuclei per sample and are representative of 3 independent experiments.
(C) DNA replication assayed by total incorporation of [α-33P]dCTP at the indicated time points. Data shown are mean and standard error from 3 independent experiments.
(D) DNA replication visualized by incorporation of Cy3-dUTP.
(E) Quantification of integrated fluorescence intensity from (D). Bars represent mean and standard error from > 30 nuclei per sample and are representative of 3 independent experiments.
(F) Histone H1 kinase assay was performed at 0 and 20 min after calcium addition.
Scale bars, 10 μm.
See also Figure S2.

