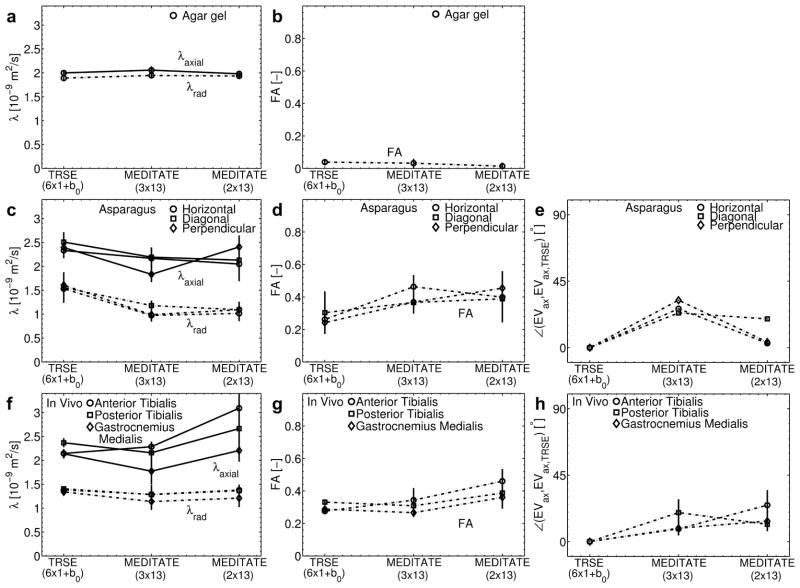
Figure 9.
Comparison of the eigenvalues (λaxial and λradial), Fractional Anisotropy (FA) and the axial diffusion direction (difference angle with the axial eigenvector estimated with the TRSE-sequence) of an isotropic phantom (agar gel) (a,b), an anisotropic phantom (asparagus stalks in horizontal and diagonal in-plane and perpendicular out-of-plane directions) (c,d,e) and in vivo calf muscle (5 volunteers; f,g,h) sampled over a ROI in DTI parameter maps obtained from a TRSE-sequence (6 directions + b0) and the MEDITATE sequence (3 and 2 series of 13 directions, one series is a reference series) (Example ROIs illustrated in Figure 7d). Phantom eigenvalues and FA are displayed as the mean and standard deviation of values taken from ROIs in the same phantom; the phantom diffusion direction is calculated using the mean axial eigenvector of ROIs. The in vivo results are the mean and standard deviation of DTI parameters across all 5 subjects in the designated ROI.

