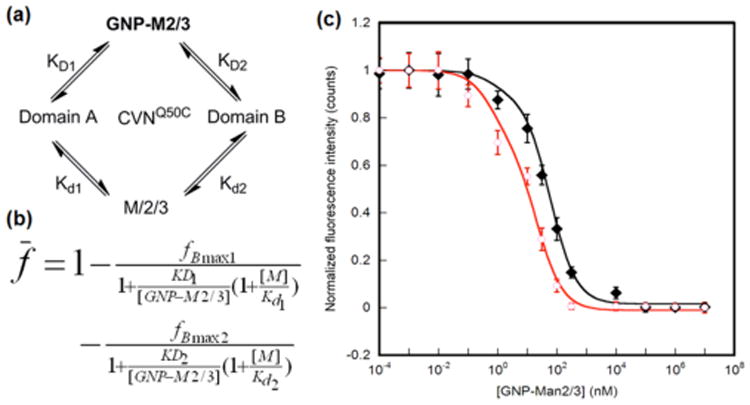
Fig. 3.

Fluorescence competition assay. a) Schematic representation of binding scenario. b) Modified Cheng-Prusoff equation based on a competitive two site binding model, where [M] is the concentration of the free ligand, and Kd1 and Kd2 are the dissociation constants of the free ligand for the glycan-binding sites on Domains A and B of CVNQ50C, respectively. The data were fitted using the maximum bound fractions, fBmax1 and fBmax2, corresponding to the two binding sites, and dissociation constants KD1 and KD2 as adjustable parameters. c) Concentration response curves of GNP-M2 and GNP-M3.
