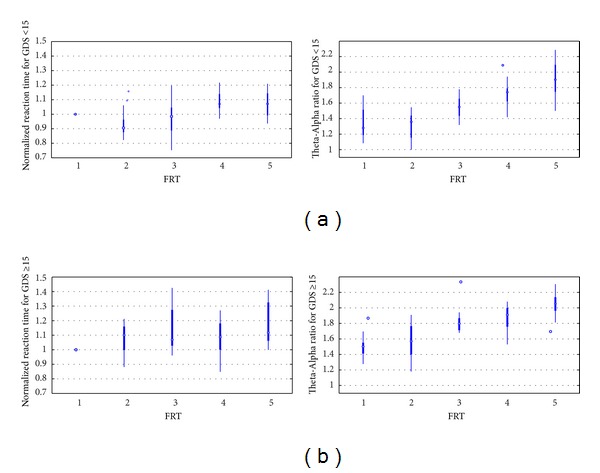
Figure 5.

Box plot showing the evolution of baseline-normalized cued response time during modified functional reach tasks (FRT) and the Theta-Alpha power ratio during quiet standing in-between FRT for (a) “nondepressed” (GDS < 15) QEEG group and (b) “depressed” (GDS ≥ 15) QEEG group.
