
Figure 3.
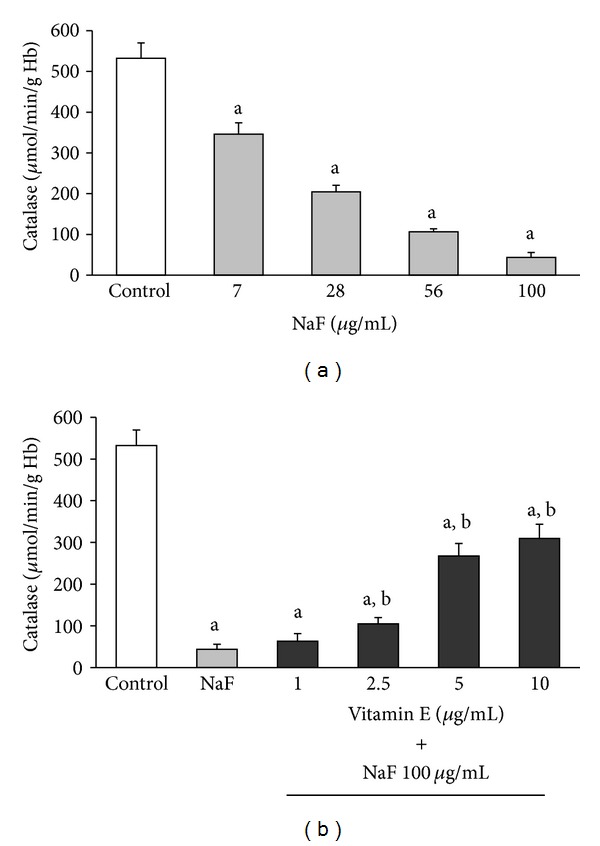
CAT activity in erythrocytes incubated under the same conditions described in Figure 2. The results are expressed as the mean ± standard deviation of five independent experiments, taking two samples per experiment and performing the determinations in triplicate. a P < 0.05 compared with the control group; b P < 0.05 compared with the group incubated with only 100 μg/mL NaF.