
Figure 1.
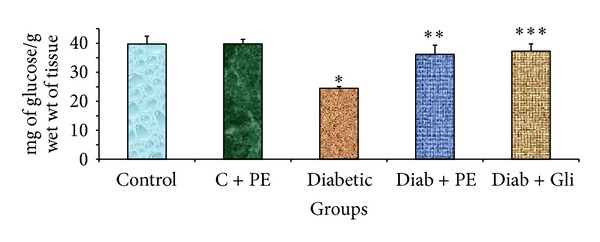
Changes in the total carbohydrate levels in the liver tissue of experimental rats. The bars with different number of asterisks vary significantly at P < 0.05. C: control, PE: plant extract, Diab: diabetic, and Gli: glibenclamide.
Official websites use .gov
A
.gov website belongs to an official
government organization in the United States.
Secure .gov websites use HTTPS
A lock (
) or https:// means you've safely
connected to the .gov website. Share sensitive
information only on official, secure websites.
Changes in the total carbohydrate levels in the liver tissue of experimental rats. The bars with different number of asterisks vary significantly at P < 0.05. C: control, PE: plant extract, Diab: diabetic, and Gli: glibenclamide.