Figure 5.

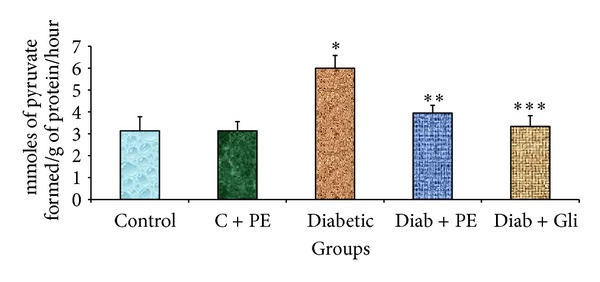
Changes in ALT levels in the liver tissue of experimental rats. The bars with different number of asterisks vary significantly at P < 0.05. C: control, PE: plant extract, Diab: diabetic, and Gli: glibenclamide.

Changes in ALT levels in the liver tissue of experimental rats. The bars with different number of asterisks vary significantly at P < 0.05. C: control, PE: plant extract, Diab: diabetic, and Gli: glibenclamide.