
Figure 8.
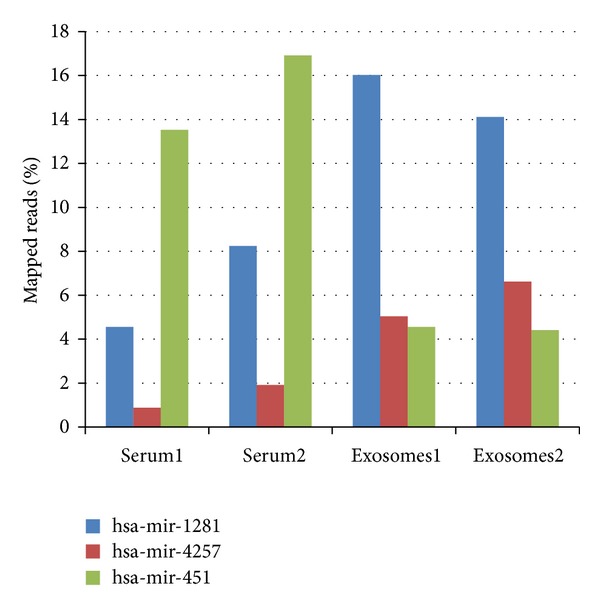
Differential representation of specific miRNAs in exosomes versus parental serum samples. Quantities were normalized by the percentage of reads aligned to that transcript out of the total mapped.
Official websites use .gov
A
.gov website belongs to an official
government organization in the United States.
Secure .gov websites use HTTPS
A lock (
) or https:// means you've safely
connected to the .gov website. Share sensitive
information only on official, secure websites.
Differential representation of specific miRNAs in exosomes versus parental serum samples. Quantities were normalized by the percentage of reads aligned to that transcript out of the total mapped.