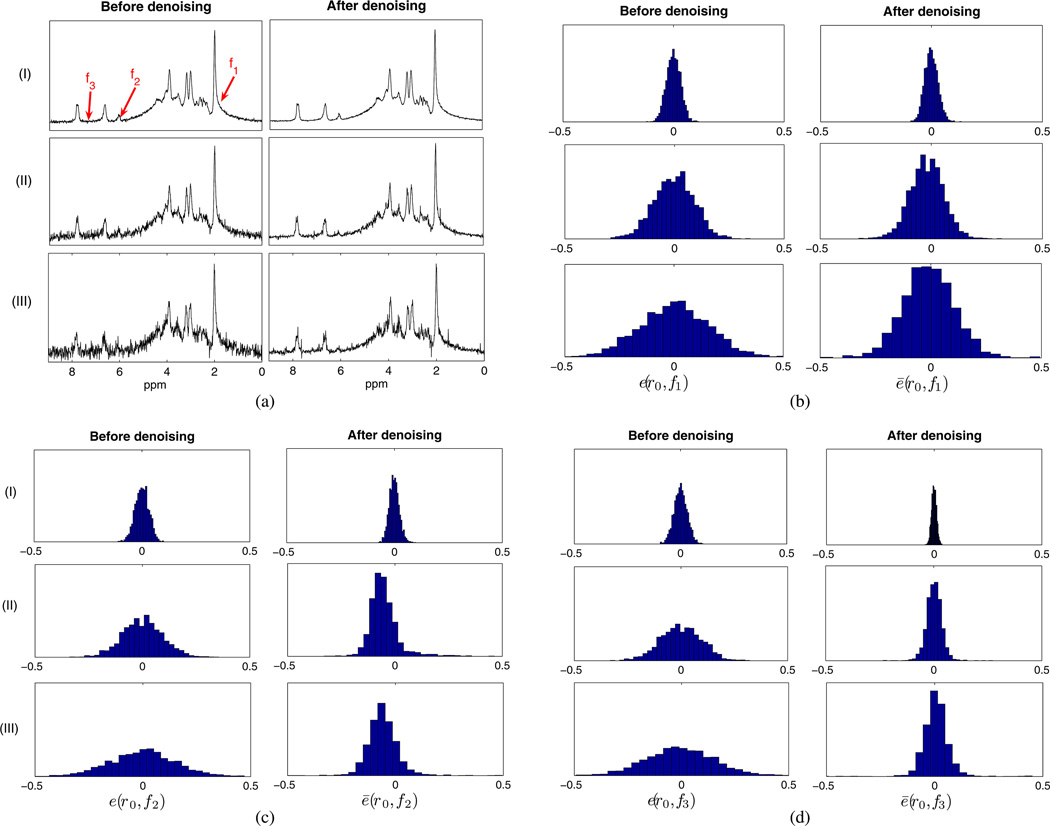
Fig. 8.
Monte Carlo study of low-rank filtering based on linear predictability: (a) representative noisy and denoised spectra at three noise levels; (b)–(d) error distributions calculated as the histograms of e and ē according to (21) at particular locations (r0, f1), (r0, f2), and (r0, f3), respectively. For this illustrative example, r0 is a representative voxel in the white matter region marked as “2” in Fig. 3(f) and f1, f2, and f3 are the frequency points marked in Fig. 8(a). Notice that the denoising performance is frequency dependent.

