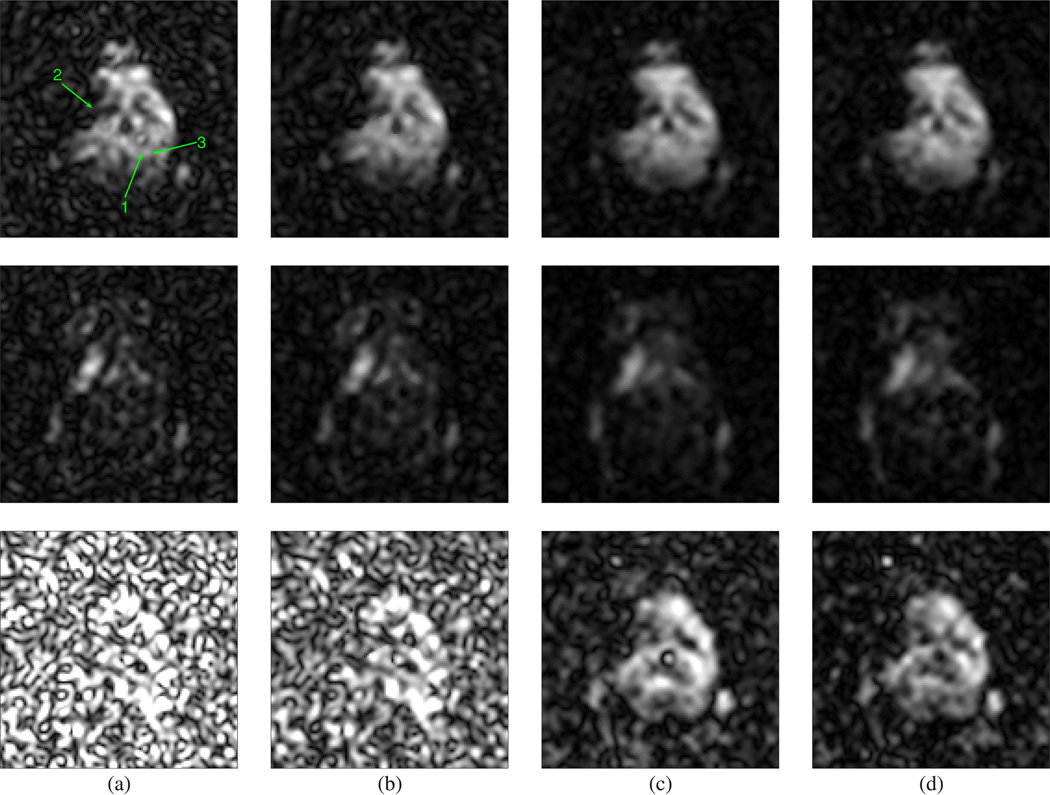
Fig. 9.
Denoising results from in vivo experimental data. Spatial distributions corresponding to NAA in the region from 1.9 to 2.1 ppm (top row), Lac in the region from 1.2 to1.37 ppm (middle row), and Glx in the region from 2.7 to 2.8 ppm (bottom row) obtained from (a) noisy data; (b) spatial denoising; (c) PS-based low-rank filtering; (d) LP-based low-rank filtering of the results in (c) (the final output of LORA).

