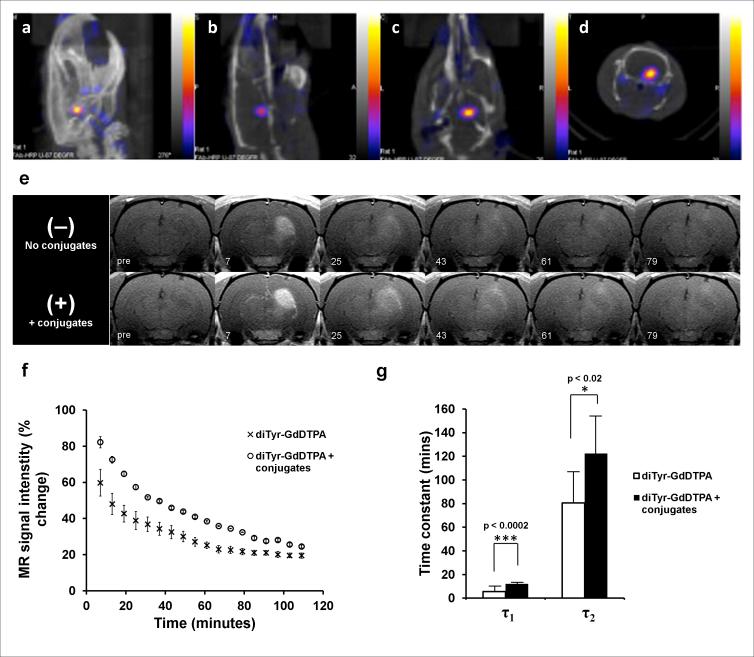
Figure 5.
SPECT/CT and 3T MR imaging of U87ΔEGFR human glioma xenografts in the rat brain. SPECT/CT images are shown with: (a) maximum intensity pixel (MIP) projection images, and (b) sagittal, (c) coronal, and (d) axial projections of an athymic rat brain bearing a U87ΔEGFR xenograft. Color scale corresponds to measured radioactivity reflecting the accumulation of 99mTc-labeled mAb F(ab’)2 conjugates in U87ΔEGFR xenografted tumors. (e) Sequential T1-weighted rat brain images depicting enhancement as a function of time after injection of diTyr-GdDTPA. Top row – temporal washout of diTyr-GdDTPA with no conjugate pre-injection (Day 1). Bottom row – washout of diTyr-GdDTPA following pre-treatment with EMD72000 mAb F(ab’)2 conjugates (Day 2) in the same slice for the same animal. Time intervals (in minutes) after the injection of diTyr-GdDTPA are shown below. (f) Normalized signal intensities measured in the whole volume of U87ΔEGFR tumor slices from a representative animal prior to (crosses) and post injection of conjugates (circles) as a function of time post-diTyr-GdDTPA substrate injection. The signal intensities are normalized as a percent change relative to the pre-contrast image. (g) Decay time constants (DTCs) measured from normalized T1-weighted signal intensities of diTyr-GdDTPA washout in the tumor region of animals with U87ΔEGFR tumors (n=5) prior to injection of conjugates (white bars), or after pre-injection of EMD72000 mAb F(ab’)2 conjugates (black bars). Tumor ROI regions of animals on both days with and without pre-injection of EMD72000 mAb F(ab’)2 conjugates exhibited biexponential signal decay. Both DTCs (τ1 and τ2) were significantly greater in the presence of EMD72000 mAb F(ab’)2 conjugates compared to only diTyr-GdDTPA substrate injection.

